Full Name
Mobile No.
Email ID
Concern
Select Type
Course Feedback
Grievance
Course Enquiry
Describe your concern
Your Concern
Select Concern
Payment
Certificate
Registration / Login
Wrong Course Opted
Course
AI-Driven Computing and Algorithm Design Using DSA
Code Mastery With Springboot
Analytical Techniques Used in Screening of Herbal Drugs
Data Analysis Using Advanced Excel
Omnichannel Retail and CRM
Automation Fundamentals
Creative Learning, Mindful Productivity and Personality Development
Mission UPSC & MPPSC Selection – Are You Ready?
CAD to Career: Industry Oriented Auto CAD
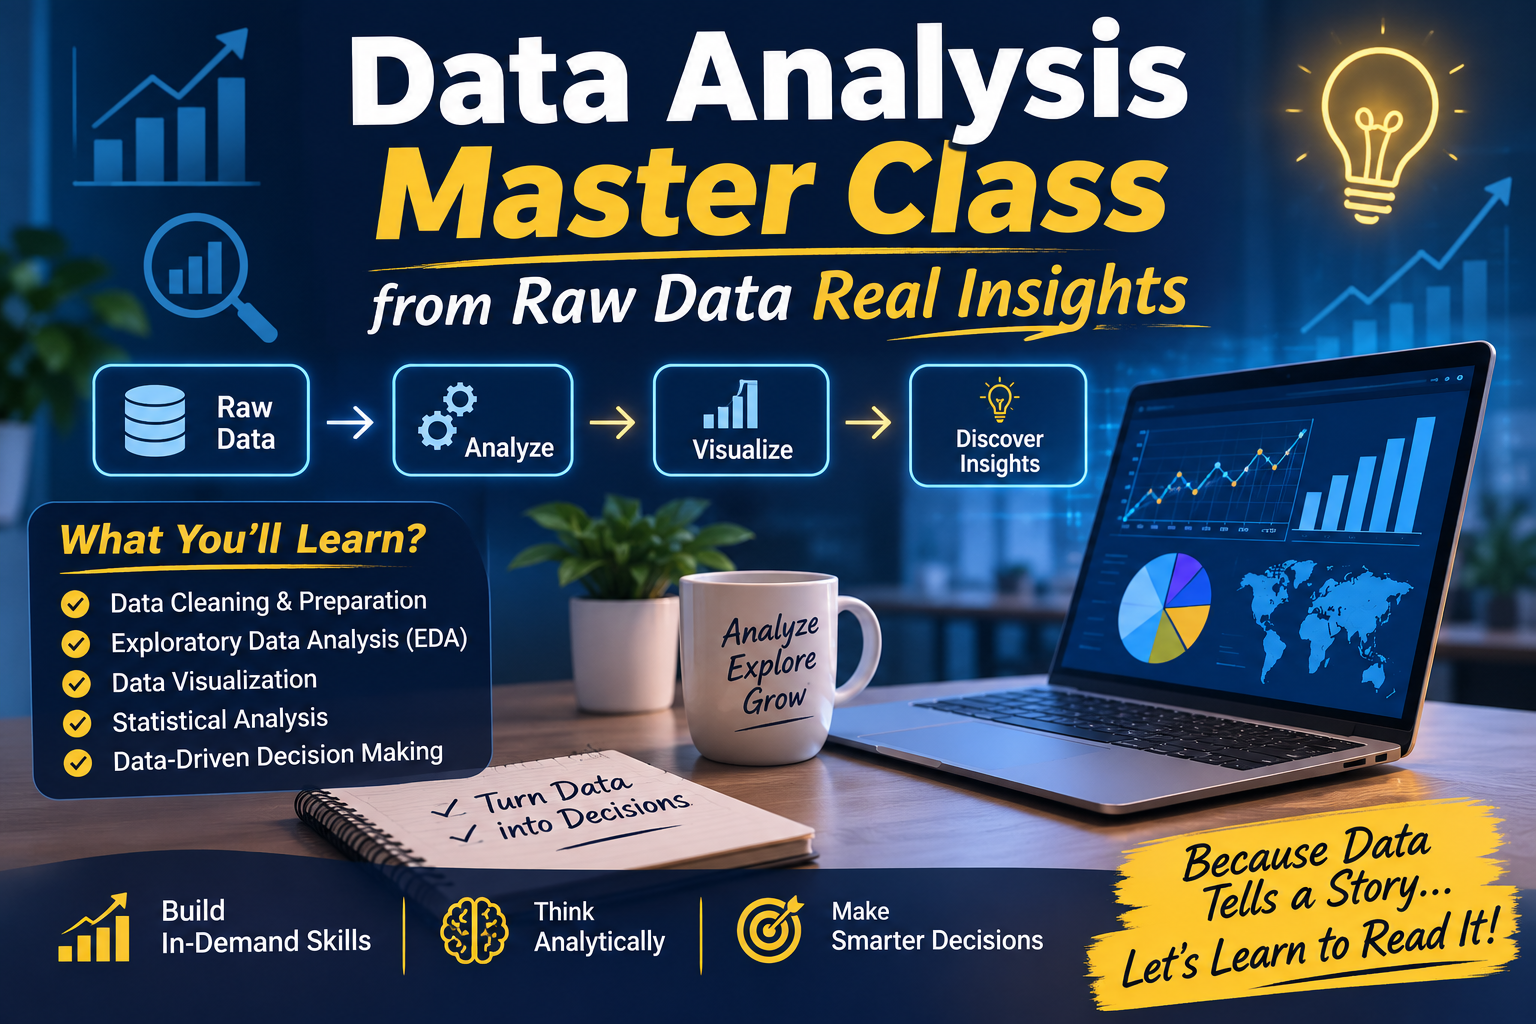
Data Analysis Master Class from Raw Data Real Insights
Managerial Skills and AI Tools
IOT & Embedded System: Fundamentals and Applications
Certificate Course in Cell Biology
Generative AI and Large Language Models (LLMs)
Frontiers in Life Sciences: Technologies and Solutions for UN SDGs
Siemens NX: Industry-Oriented CAD Design and Manufacturing Application
Data Analysis With Power BI
CPCT Complete Preparation Program
Industrial Internet of Things (IIoT): Smart Sensors, Connected Devices
Applied DSA & Competitve Problem Solving
Design Beyond Limits: AutoCAD for Civil & Mechanical Engineers
RAG Workshop: Build AI Apps That Know Your Data
Use of AI in Civil Engineering.
AI application development using python
AI- Powered Computing and Future Technologies
AI in Action: Project-Based Learning in Intelligent Computing
Problem Solving with Java and DSA
Future with Machine Learning
AI Powered Web Application Development
Generative AI and AI Application Development
Hands-On Practice on UV and HPLC
Forensic Science, Digital Evidence and Criminal Trial Advocacy
Research and challenges of Research Integrity
Modern Tools for Web development.
Mastering JAVA:Object Oriented Programming and Application Development
Emerging Trends inPharmaceutical Chemistry:AI,Analytics&Sustainability
Horizon : Exploring Social Sciences Beyond Boundaries of Books
Build your Own Chatboat using Gen AI.
Creative Thinking Processes and Methods
Artificial Intelligence and Emerging Technologies
Broadcast Journalism, News Anchoring and Live Production
Internet of Things (IoT) and Smart Device Development
Climate Smart Agriculture
“Emerging Trends and Innovations in Agribusiness Management.”
Google Cloud Platform Foundation
Applied AI: Real World Application Development using AI
IOS App Design and Development
GenAI with OpenAI and Python
Impact of AI Adoption on Financial Performance and Managerial Effect
Clinical Edge blueprints on Clinical Trails and Pharmacovigilance
C++ and Object-Oriented Programming: Fundamental to Real World Project
From Design to Part: Hands-on CNC Machining and 3D Printing
AI For Every One Smart Work With Artificial Intelligence
Hands on Training on Advance Analytical Techniques
Digital Marketing Basics
Competitive Programming and Algorithmic Thinking
Generative AI_ Leadership Towards Tomorrow
20-Hour Industry-Oriented Training Program on Web Product Development
Tally Prime: From Basics to Advanced Accounting
Digital Commerce Economics and Revenue Optimization
Introduction to AWS Cloud-Based Machine Learning & Intelligent System
Legal Drafting, Pleading And Advocacy: From Theory to Practice
Certificate Course in Tally Prime and Business Accounting
Job Readiness and Career Skills
Robotics, Automation & IoT with Arduino and ESP32
Professional Diploma in Java Full-Stack Development
Professional Diploma in Python Programming and Application Development
Advanced Certification in Python for Data Analysis & Automation
Professional Diploma in Data Analytics and Business Intelligence
Professional Diploma in AI-Enabled Full-Stack Web Development
Advanced Certification in Data Analytics and Visualization
Advanced Certification in AI-Powered Web Development
Advanced Certification in Java Programming
Technical Fundamentals for Placements
Certificate Course in Dermatoglyphics
Placement Readiness & Employability Skills
Certificate in Python Programming
Certificate in C Programming
HR Analytics Essentials
Certificate in Data Analytics
Certificate in Java Programming
Certificate in AI-Enabled Web Technology
Integrated MPPSC Preparation Course
Certificate Course in Cell Biology
Experimental techniques in Biological Sciences
Certificate Course in Counselling Tools&Techniques
Certificate Course in Diagnostic Electrophoresis
Certificate Course in Mutation Research
Certificate Course in Clinical Microbiology
Basics of Python Programming for Pharmacy Students
Tribal Masks: A Reflection of India's Traditional Knowledge Systems
Transform technologies of Artificial Intelligence, Augmented Reality, Virtual Reality, and Mixed Reality
How Artificial Intelligence is Transforming Journalism and Performing Arts: Creativity vs Authenticity
Advanced Training in Laboratory Animal Handling and Preclinical Pharmacological Screening
Personality Development for Professionals
AgriXperience 1.0: Hands-On Training Agri- Lab Skills & Smart Tech
Fundamentals of Generative AI & Large Language Models(LLMs)
Cyber Law And Digital Security In India
Artificial Intelligence and Enhancing Communication Skills
AI for Budding Managers : Tools & Applications - module 2
Smart Infrastructure & Urban Planning Using AI
AI-Enabled Full Stack Development
AI-Based Virtual Assistants: Siri and Alexa
Structural and Material Engineering Using AI
Integrating Artificial Intelligence in Experimental Pharmacology: Bridging in Silico Prediction with in Vivo Validation
Python Basics to Brilliance: A Journey from Beginner to Confident Coder
Generative AI Lab: Create Smarter Systems and Smarter Ideas
AI Tools for Future Ready Management Smart Decision Making & Digital Leadership
AI-powered facial recognition
Emerging Trends in Cyber Security and Data Privacy
Mastering Power BI for Data Analytics
IOT Revolution Connecting the Future
Image Building & personality Devlopment
Industrial Automation & IIoT 4.0
Entrepreneurial Mindset and startup skills
Design in Pixels: Photoshop
API to Finished Product in Pharmaceutical Dosage Form
Java Foundations for Future Software Developers
Agentic AI: From Prompting to Autonomous Intelligence
Advanced Training Program on Drug Development and Analysis
Business Intelligence with Power BI
Robotics & AI
Recent Innovations in Electric Vehicle Design, Advanced Materials, and Manufacturing Technologies
Introduction to IoT: Concepts and Applications
AI in supply chain management
Python Ignite Program: Beginner to Project Builder
Digital Marketing
Learn Blockchain the Bitcoin Way
Power BI – Data to Dashboard
Machine Learning Applications with Agentic AI
CAD Verse: From Idea to Production
Recent Advancements in Cyber Forensics and Insurance Investigations
Next-Gen Embedded System Design
Master in Laravel with industry Expert
Generative AI Revolution: Transforming Ideas into Reality
Experimental Techniques in Biochemistry, Microbiology and Molecular Biology: A Practical Approach
Building Information Modeling (BIM) & Future Construction Technologies
Code Smart with Spring Boot
Internet of Things (IOT) based embedded system design
AI's Ascent: From Consumers to Creators
Bootcamp for Data Analysis: Python, NumPy, and Pandas
Introduction to Indian Knowledge System
Corporate Skill Required to Succeed After BBA
Change, Transformation and People: Navigating the Human Side of Organizational Evolution
Agentic AI
Data Analyst Master Class by Using Power BI, SQL, and MS Excel
Cell Biology
Instrumentation in Clinical Research
Integrating Digital Health and Telemedicine into Nursing Practice
Good Clinical Practice (GCP) & Good Laboratory Practice (GLP)
Fundamentals of Generative AI & prompt engineering
Indian Knowledge System in Banking & Finance: Tradition to Transformation
Skill Up With Income Tax Act 2025
Vocal Music Workshop With Creative Digital Notation
Entrepreneurial Mindset & Innovation Management
Full Stack Web Development with Python(Django, Flask & Fast API)
Pathways to Civil Services Examinations
Diagnostic Electrophoresis
Alternative Dispute Resolution: Law, Practice, and Emerging Trends in India.
Hands-on IoT Development using ESP8266 and Sensors
Clinical Microbiology
Competitive Programming
FutureAg: Advancing Agriculture for Tomorrow
Tide Turners: Innovations in Aquatic Science
Mutual Funds and Wealth Creation: Practical Perspectives
Hands on Training on Chromatographic and Spectroscopic Technique
Interactive Web Development with HTML, CSS & JavaScript
AI for Budding Managers : Tools and Application
Data Analysis Using Advanced Excel And AI
Communication Skills Talk to Masses
Leadership Skills by Shri N. Raghuraman
Project Design and Development
Artificial Intelligence (AI) Fundamentals & Prompt Engineering
Certificate Course in Dermatoglyphics
Certificate course in Counselling tools and Techniques
visa assistance intelligence visa guidance with AI agent
Green Biotech Skill Enhancement Course
Certificate Course in Mutation Research.
Certificate Course in Cell Biology
Applied Python: Build Applications & Solve Problems
transforming nursing through artificial intelligence, education -practice &innovation.
DATA ANALYSIS MASTERCLASS: FROM RAW DATA TO REAL INSIGHTS
HACKDEFEND: 15 DAYS TO CYBER ADVANCEMENT
Next Generation Biofertilizers & Biopesticide :Genomics-Driven Innovations for Sustainable Agriculture
Basics of Robotics & Artificial Intelligence
Women,Chidren & The New Criminal Laws:Understanding Protection, Rights and Reforms
Business Model Innovation and Startup Plan Development
Generative AI Lab: Create Smarter Systems and Smarter Ideas
AI tools for modern Business
Dance & Music
CERTIFICATION COURSE IN BANKING, FINANCE & INSURANCE
Marketing Accelator Series
Python with Power BI
CBT and Mindfulness-Based Emotional Wellbeing Program
The Art of Photography for Young Creators
Summer Sketch Fusion
Foundations of AI & Machine Learning
Mastering Core Java: Concepts to Code
AI/ML Using Python
AI, AR, VR Mixed Reality
AI in Real-World Applications & Data Science Techniques
From Zero to Hero - Mastering Ai with IOT
Impact of GST on Startup Growth and Compliance in India
Personality Development for Professionals
Data Analysis using advance Excel
Introduction to Advance concept of Block Chain Technology
Robotics AI Robotic arms and manipulators • End-effectors and grippers • Safety systems in industrial robots • Flexible automation and robotic cells • Industry 4.0 and smart manufacturing
MS Office for Everyone: Core Foundations & Practical Applications
Generative AI for business with Azure AI
AI-Driven Digital Marketing: Planning, Execution, and Optimization
Value Addition & Food Safet skill Development for New Age Entrepreneurs
Emotional Intelligence
Futuristic Project Based Learning using AI/ML
System Programming Using C
Programming Using C
NextGen Forensics Week: Innovate Investigate Inspire
Utilizations of Solid Works with 3D Printing
Web App development using Flutter
Essentials of Digital Marketing in Retail Business
Teacher Impact Program for Personal and Professional Growth
Visual Data Analytics with PowerBI
Transformative Developments in the Indian Criminal Justice System.
Technological Advancement for Agricultural Sustainability and Food Secruity
Hands On Training on Data Science & Machine Learning
7-Day Hands on Training Program in Electronics, Scientific Writing & Digital Literacy
INTEGRATED BUILDING DESIGN & BIM TOOLS TRAINING
AI for Creativity
GenAI Innovation Sprint
Traditional Home Remedies for common Aliment
Think in java logic coding
Agentic AI: Principles and Practice
Electric Vehicles installation and design
Python programming with AI tools
Opportunities in clinical research and Pharmacovigilience studies
INDUSTRY COLLABORATED HANDS-ON TRAINING IN TABLET FORMULATION AND QUALITY EVALUATION
Java Programming for Beginners
Use of Modern Software in Mechanical Engineering
Title of SWS Java Programming for Beginners
Corporate ethics & etiquettes
Data Visualization for Career Advancement
Data Science and Analytics: From Data to Decision-Making
Practical Accounting & Global Software Bootcamp
Formulate to Nourish: Pharma-Crafted Nutraceutical Delights
“Intellectual Property Rights in Academia: Legal Foundations, Emerging Trends, and Innovation-Driven Applications”
Smart Finance: Empowering Lives Through Financial Literacy
Tools and Techniques of AI and Cyber Security.
Photoshop Fundamentals: From Beginner to Pro
Software Developer Essentials
IOT & Robotics
Structure Biology and Bioinformatics
Power BI
Learn Cyber Security With hands on session on preventing cyber attacks
Soil Testing for Sustainable Agriculture: A Hands-On Training for Students and Agri-Entrepreneurs
Learn French Language With Us
Data Science & Visualization with Python
Startup & its Anticipatory Management
Use of AI in Civil Engineering
Bhartiya History & Present Scenario
NextGen Coders: Developing Future-Ready Applications
Mobile Application Development
Media and Different Art Forms
UI/UX Design
Crypto currency: Future Money
Microorganisms from Varied Habitats: Identification and Functional Analysis
Iot, Robotics & Mechatronics : Smart Future
Digital Trials in India : Legal Technological and Practical perspectives
Professional Grooming and Business Etiquette
Sales Strategy & Consumer Behaviour
The Role of Alternative Dispute Resolution in Modern Legal Systems
AI Based Electrical Tools
Penetration Testing with Windows
Zero to Hero: C++, DSA & Jobs
Data Forensics
PARAMPARA – A Summer Kathak Retreat
Generative AI Tools for Web development & Data Analytics
Mastering Quantitative & Qualitative Aptitude for MBA Placements: Cracking the Code to Corporate Success
Generative-Ai
Full Stack development with MERN Stack
Visual Merchandising and Supply Chain Management
Foundations of Retail Management
Store and Retail Operations Management
Industrial Automation With IOT
Application of Embedded in real life
Significance Role of 3D modeling Softwares (NX) for an Industrial applications
Omnichannel Retail Operations Management
LORA Protocol (long range wide area network)
Web Development Using React Framework
Android App Development
Web Application Development
Data Analytics with Power BI
The Role of Innovative Techniques in Boosting Agricultural Productivity
Color Theory Lab
Python with DSA
ESCALATE YOUR OFFICE SOFT SKILLS
Unlocking Fisheries: The Science behind the Sustainable practices
From Campus to Corporate: Personality Enrichment Program
Web Application Development using flutter
Pharmacovigilance: Measures to ensure drug safety
Disaster Management and Business Continuity Planning
How to file Income Tax Return for Salaried Person
Industrial Internet of Things (IIoT)
Innovative Drug Delivery : Design, Profiling and Potential of Novel Therapeutics
Python for Data Preprocessing: Shaping Data for Analysis
Quant to Qualify: The Ultimate Aptitude Series
Azure Machine Learning Studio
IoT and it's Applications
Basic AI Tools for Managers
Enhancing Power of Programming through Logic Building
Digital marketing and Social Media
Digital Branding for Startups: Build, Promote and Grow
Wrong Course Selecetd
AI-Driven Computing and Algorithm Design Using DSA
Code Mastery With Springboot
Analytical Techniques Used in Screening of Herbal Drugs
Data Analysis Using Advanced Excel
Omnichannel Retail and CRM
Automation Fundamentals
Creative Learning, Mindful Productivity and Personality Development
Mission UPSC & MPPSC Selection – Are You Ready?
CAD to Career: Industry Oriented Auto CAD
Data Analysis Master Class from Raw Data Real Insights
Managerial Skills and AI Tools
IOT & Embedded System: Fundamentals and Applications
Certificate Course in Cell Biology
Generative AI and Large Language Models (LLMs)
Frontiers in Life Sciences: Technologies and Solutions for UN SDGs
Siemens NX: Industry-Oriented CAD Design and Manufacturing Application
Data Analysis With Power BI
CPCT Complete Preparation Program
Industrial Internet of Things (IIoT): Smart Sensors, Connected Devices
Applied DSA & Competitve Problem Solving
Design Beyond Limits: AutoCAD for Civil & Mechanical Engineers
RAG Workshop: Build AI Apps That Know Your Data
Use of AI in Civil Engineering.
AI application development using python
AI- Powered Computing and Future Technologies
AI in Action: Project-Based Learning in Intelligent Computing
Problem Solving with Java and DSA
Future with Machine Learning
AI Powered Web Application Development
Generative AI and AI Application Development
Hands-On Practice on UV and HPLC
Forensic Science, Digital Evidence and Criminal Trial Advocacy
Research and challenges of Research Integrity
Modern Tools for Web development.
Mastering JAVA:Object Oriented Programming and Application Development
Emerging Trends inPharmaceutical Chemistry:AI,Analytics&Sustainability
Horizon : Exploring Social Sciences Beyond Boundaries of Books
Build your Own Chatboat using Gen AI.
Creative Thinking Processes and Methods
Artificial Intelligence and Emerging Technologies
Broadcast Journalism, News Anchoring and Live Production
Internet of Things (IoT) and Smart Device Development
Climate Smart Agriculture
“Emerging Trends and Innovations in Agribusiness Management.”
Google Cloud Platform Foundation
Applied AI: Real World Application Development using AI
IOS App Design and Development
GenAI with OpenAI and Python
Impact of AI Adoption on Financial Performance and Managerial Effect
Clinical Edge blueprints on Clinical Trails and Pharmacovigilance
C++ and Object-Oriented Programming: Fundamental to Real World Project
From Design to Part: Hands-on CNC Machining and 3D Printing
AI For Every One Smart Work With Artificial Intelligence
Hands on Training on Advance Analytical Techniques
Digital Marketing Basics
Competitive Programming and Algorithmic Thinking
Generative AI_ Leadership Towards Tomorrow
20-Hour Industry-Oriented Training Program on Web Product Development
Tally Prime: From Basics to Advanced Accounting
Digital Commerce Economics and Revenue Optimization
Introduction to AWS Cloud-Based Machine Learning & Intelligent System
Legal Drafting, Pleading And Advocacy: From Theory to Practice
Certificate Course in Tally Prime and Business Accounting
Job Readiness and Career Skills
Robotics, Automation & IoT with Arduino and ESP32
Professional Diploma in Java Full-Stack Development
Professional Diploma in Python Programming and Application Development
Advanced Certification in Python for Data Analysis & Automation
Professional Diploma in Data Analytics and Business Intelligence
Professional Diploma in AI-Enabled Full-Stack Web Development
Advanced Certification in Data Analytics and Visualization
Advanced Certification in AI-Powered Web Development
Advanced Certification in Java Programming
Technical Fundamentals for Placements
Certificate Course in Dermatoglyphics
Placement Readiness & Employability Skills
Certificate in Python Programming
Certificate in C Programming
HR Analytics Essentials
Certificate in Data Analytics
Certificate in Java Programming
Certificate in AI-Enabled Web Technology
Integrated MPPSC Preparation Course
Certificate Course in Cell Biology
Experimental techniques in Biological Sciences
Certificate Course in Counselling Tools&Techniques
Certificate Course in Diagnostic Electrophoresis
Certificate Course in Mutation Research
Certificate Course in Clinical Microbiology
Basics of Python Programming for Pharmacy Students
Tribal Masks: A Reflection of India's Traditional Knowledge Systems
Transform technologies of Artificial Intelligence, Augmented Reality, Virtual Reality, and Mixed Reality
How Artificial Intelligence is Transforming Journalism and Performing Arts: Creativity vs Authenticity
Advanced Training in Laboratory Animal Handling and Preclinical Pharmacological Screening
Personality Development for Professionals
AgriXperience 1.0: Hands-On Training Agri- Lab Skills & Smart Tech
Fundamentals of Generative AI & Large Language Models(LLMs)
Cyber Law And Digital Security In India
Artificial Intelligence and Enhancing Communication Skills
AI for Budding Managers : Tools & Applications - module 2
Smart Infrastructure & Urban Planning Using AI
AI-Enabled Full Stack Development
AI-Based Virtual Assistants: Siri and Alexa
Structural and Material Engineering Using AI
Integrating Artificial Intelligence in Experimental Pharmacology: Bridging in Silico Prediction with in Vivo Validation
Python Basics to Brilliance: A Journey from Beginner to Confident Coder
Generative AI Lab: Create Smarter Systems and Smarter Ideas
AI Tools for Future Ready Management Smart Decision Making & Digital Leadership
AI-powered facial recognition
Emerging Trends in Cyber Security and Data Privacy
Mastering Power BI for Data Analytics
IOT Revolution Connecting the Future
Image Building & personality Devlopment
Industrial Automation & IIoT 4.0
Entrepreneurial Mindset and startup skills
Design in Pixels: Photoshop
API to Finished Product in Pharmaceutical Dosage Form
Java Foundations for Future Software Developers
Agentic AI: From Prompting to Autonomous Intelligence
Advanced Training Program on Drug Development and Analysis
Business Intelligence with Power BI
Robotics & AI
Recent Innovations in Electric Vehicle Design, Advanced Materials, and Manufacturing Technologies
Introduction to IoT: Concepts and Applications
AI in supply chain management
Python Ignite Program: Beginner to Project Builder
Digital Marketing
Learn Blockchain the Bitcoin Way
Power BI – Data to Dashboard
Machine Learning Applications with Agentic AI
CAD Verse: From Idea to Production
Recent Advancements in Cyber Forensics and Insurance Investigations
Next-Gen Embedded System Design
Master in Laravel with industry Expert
Generative AI Revolution: Transforming Ideas into Reality
Experimental Techniques in Biochemistry, Microbiology and Molecular Biology: A Practical Approach
Building Information Modeling (BIM) & Future Construction Technologies
Code Smart with Spring Boot
Internet of Things (IOT) based embedded system design
AI's Ascent: From Consumers to Creators
Bootcamp for Data Analysis: Python, NumPy, and Pandas
Introduction to Indian Knowledge System
Corporate Skill Required to Succeed After BBA
Change, Transformation and People: Navigating the Human Side of Organizational Evolution
Agentic AI
Data Analyst Master Class by Using Power BI, SQL, and MS Excel
Cell Biology
Instrumentation in Clinical Research
Integrating Digital Health and Telemedicine into Nursing Practice
Good Clinical Practice (GCP) & Good Laboratory Practice (GLP)
Fundamentals of Generative AI & prompt engineering
Indian Knowledge System in Banking & Finance: Tradition to Transformation
Skill Up With Income Tax Act 2025
Vocal Music Workshop With Creative Digital Notation
Entrepreneurial Mindset & Innovation Management
Full Stack Web Development with Python(Django, Flask & Fast API)
Pathways to Civil Services Examinations
Diagnostic Electrophoresis
Alternative Dispute Resolution: Law, Practice, and Emerging Trends in India.
Hands-on IoT Development using ESP8266 and Sensors
Clinical Microbiology
Competitive Programming
FutureAg: Advancing Agriculture for Tomorrow
Tide Turners: Innovations in Aquatic Science
Mutual Funds and Wealth Creation: Practical Perspectives
Hands on Training on Chromatographic and Spectroscopic Technique
Interactive Web Development with HTML, CSS & JavaScript
AI for Budding Managers : Tools and Application
Data Analysis Using Advanced Excel And AI
Communication Skills Talk to Masses
Leadership Skills by Shri N. Raghuraman
Project Design and Development
Artificial Intelligence (AI) Fundamentals & Prompt Engineering
Certificate Course in Dermatoglyphics
Certificate course in Counselling tools and Techniques
visa assistance intelligence visa guidance with AI agent
Green Biotech Skill Enhancement Course
Certificate Course in Mutation Research.
Certificate Course in Cell Biology
Applied Python: Build Applications & Solve Problems
transforming nursing through artificial intelligence, education -practice &innovation.
DATA ANALYSIS MASTERCLASS: FROM RAW DATA TO REAL INSIGHTS
HACKDEFEND: 15 DAYS TO CYBER ADVANCEMENT
Next Generation Biofertilizers & Biopesticide :Genomics-Driven Innovations for Sustainable Agriculture
Basics of Robotics & Artificial Intelligence
Women,Chidren & The New Criminal Laws:Understanding Protection, Rights and Reforms
Business Model Innovation and Startup Plan Development
Generative AI Lab: Create Smarter Systems and Smarter Ideas
AI tools for modern Business
Dance & Music
CERTIFICATION COURSE IN BANKING, FINANCE & INSURANCE
Marketing Accelator Series
Python with Power BI
CBT and Mindfulness-Based Emotional Wellbeing Program
The Art of Photography for Young Creators
Summer Sketch Fusion
Foundations of AI & Machine Learning
Mastering Core Java: Concepts to Code
AI/ML Using Python
AI, AR, VR Mixed Reality
AI in Real-World Applications & Data Science Techniques
From Zero to Hero - Mastering Ai with IOT
Impact of GST on Startup Growth and Compliance in India
Personality Development for Professionals
Data Analysis using advance Excel
Introduction to Advance concept of Block Chain Technology
Robotics AI Robotic arms and manipulators • End-effectors and grippers • Safety systems in industrial robots • Flexible automation and robotic cells • Industry 4.0 and smart manufacturing
MS Office for Everyone: Core Foundations & Practical Applications
Generative AI for business with Azure AI
AI-Driven Digital Marketing: Planning, Execution, and Optimization
Value Addition & Food Safet skill Development for New Age Entrepreneurs
Emotional Intelligence
Futuristic Project Based Learning using AI/ML
System Programming Using C
Programming Using C
NextGen Forensics Week: Innovate Investigate Inspire
Utilizations of Solid Works with 3D Printing
Web App development using Flutter
Essentials of Digital Marketing in Retail Business
Teacher Impact Program for Personal and Professional Growth
Visual Data Analytics with PowerBI
Transformative Developments in the Indian Criminal Justice System.
Technological Advancement for Agricultural Sustainability and Food Secruity
Hands On Training on Data Science & Machine Learning
7-Day Hands on Training Program in Electronics, Scientific Writing & Digital Literacy
INTEGRATED BUILDING DESIGN & BIM TOOLS TRAINING
AI for Creativity
GenAI Innovation Sprint
Traditional Home Remedies for common Aliment
Think in java logic coding
Agentic AI: Principles and Practice
Electric Vehicles installation and design
Python programming with AI tools
Opportunities in clinical research and Pharmacovigilience studies
INDUSTRY COLLABORATED HANDS-ON TRAINING IN TABLET FORMULATION AND QUALITY EVALUATION
Java Programming for Beginners
Use of Modern Software in Mechanical Engineering
Title of SWS Java Programming for Beginners
Corporate ethics & etiquettes
Data Visualization for Career Advancement
Data Science and Analytics: From Data to Decision-Making
Practical Accounting & Global Software Bootcamp
Formulate to Nourish: Pharma-Crafted Nutraceutical Delights
“Intellectual Property Rights in Academia: Legal Foundations, Emerging Trends, and Innovation-Driven Applications”
Smart Finance: Empowering Lives Through Financial Literacy
Tools and Techniques of AI and Cyber Security.
Photoshop Fundamentals: From Beginner to Pro
Software Developer Essentials
IOT & Robotics
Structure Biology and Bioinformatics
Power BI
Learn Cyber Security With hands on session on preventing cyber attacks
Soil Testing for Sustainable Agriculture: A Hands-On Training for Students and Agri-Entrepreneurs
Learn French Language With Us
Data Science & Visualization with Python
Startup & its Anticipatory Management
Use of AI in Civil Engineering
Bhartiya History & Present Scenario
NextGen Coders: Developing Future-Ready Applications
Mobile Application Development
Media and Different Art Forms
UI/UX Design
Crypto currency: Future Money
Microorganisms from Varied Habitats: Identification and Functional Analysis
Iot, Robotics & Mechatronics : Smart Future
Digital Trials in India : Legal Technological and Practical perspectives
Professional Grooming and Business Etiquette
Sales Strategy & Consumer Behaviour
The Role of Alternative Dispute Resolution in Modern Legal Systems
AI Based Electrical Tools
Penetration Testing with Windows
Zero to Hero: C++, DSA & Jobs
Data Forensics
PARAMPARA – A Summer Kathak Retreat
Generative AI Tools for Web development & Data Analytics
Mastering Quantitative & Qualitative Aptitude for MBA Placements: Cracking the Code to Corporate Success
Generative-Ai
Full Stack development with MERN Stack
Visual Merchandising and Supply Chain Management
Foundations of Retail Management
Store and Retail Operations Management
Industrial Automation With IOT
Application of Embedded in real life
Significance Role of 3D modeling Softwares (NX) for an Industrial applications
Omnichannel Retail Operations Management
LORA Protocol (long range wide area network)
Web Development Using React Framework
Android App Development
Web Application Development
Data Analytics with Power BI
The Role of Innovative Techniques in Boosting Agricultural Productivity
Color Theory Lab
Python with DSA
ESCALATE YOUR OFFICE SOFT SKILLS
Unlocking Fisheries: The Science behind the Sustainable practices
From Campus to Corporate: Personality Enrichment Program
Web Application Development using flutter
Pharmacovigilance: Measures to ensure drug safety
Disaster Management and Business Continuity Planning
How to file Income Tax Return for Salaried Person
Industrial Internet of Things (IIoT)
Innovative Drug Delivery : Design, Profiling and Potential of Novel Therapeutics
Python for Data Preprocessing: Shaping Data for Analysis
Quant to Qualify: The Ultimate Aptitude Series
Azure Machine Learning Studio
IoT and it's Applications
Basic AI Tools for Managers
Enhancing Power of Programming through Logic Building
Digital marketing and Social Media
Digital Branding for Startups: Build, Promote and Grow
Course To Transfer
AI-Driven Computing and Algorithm Design Using DSA
Code Mastery With Springboot
Analytical Techniques Used in Screening of Herbal Drugs
Data Analysis Using Advanced Excel
Omnichannel Retail and CRM
Automation Fundamentals
Creative Learning, Mindful Productivity and Personality Development
Mission UPSC & MPPSC Selection – Are You Ready?
CAD to Career: Industry Oriented Auto CAD
Data Analysis Master Class from Raw Data Real Insights
Managerial Skills and AI Tools
IOT & Embedded System: Fundamentals and Applications
Certificate Course in Cell Biology
Generative AI and Large Language Models (LLMs)
Frontiers in Life Sciences: Technologies and Solutions for UN SDGs
Siemens NX: Industry-Oriented CAD Design and Manufacturing Application
Data Analysis With Power BI
CPCT Complete Preparation Program
Industrial Internet of Things (IIoT): Smart Sensors, Connected Devices
Applied DSA & Competitve Problem Solving
Design Beyond Limits: AutoCAD for Civil & Mechanical Engineers
RAG Workshop: Build AI Apps That Know Your Data
Use of AI in Civil Engineering.
AI application development using python
AI- Powered Computing and Future Technologies
AI in Action: Project-Based Learning in Intelligent Computing
Problem Solving with Java and DSA
Future with Machine Learning
AI Powered Web Application Development
Generative AI and AI Application Development
Hands-On Practice on UV and HPLC
Forensic Science, Digital Evidence and Criminal Trial Advocacy
Research and challenges of Research Integrity
Modern Tools for Web development.
Mastering JAVA:Object Oriented Programming and Application Development
Emerging Trends inPharmaceutical Chemistry:AI,Analytics&Sustainability
Horizon : Exploring Social Sciences Beyond Boundaries of Books
Build your Own Chatboat using Gen AI.
Creative Thinking Processes and Methods
Artificial Intelligence and Emerging Technologies
Broadcast Journalism, News Anchoring and Live Production
Internet of Things (IoT) and Smart Device Development
Climate Smart Agriculture
“Emerging Trends and Innovations in Agribusiness Management.”
Google Cloud Platform Foundation
Applied AI: Real World Application Development using AI
IOS App Design and Development
GenAI with OpenAI and Python
Impact of AI Adoption on Financial Performance and Managerial Effect
Clinical Edge blueprints on Clinical Trails and Pharmacovigilance
C++ and Object-Oriented Programming: Fundamental to Real World Project
From Design to Part: Hands-on CNC Machining and 3D Printing
AI For Every One Smart Work With Artificial Intelligence
Hands on Training on Advance Analytical Techniques
Digital Marketing Basics
Competitive Programming and Algorithmic Thinking
Generative AI_ Leadership Towards Tomorrow
20-Hour Industry-Oriented Training Program on Web Product Development
Tally Prime: From Basics to Advanced Accounting
Digital Commerce Economics and Revenue Optimization
Introduction to AWS Cloud-Based Machine Learning & Intelligent System
Legal Drafting, Pleading And Advocacy: From Theory to Practice
Certificate Course in Tally Prime and Business Accounting
Job Readiness and Career Skills
Robotics, Automation & IoT with Arduino and ESP32
Professional Diploma in Java Full-Stack Development
Professional Diploma in Python Programming and Application Development
Advanced Certification in Python for Data Analysis & Automation
Professional Diploma in Data Analytics and Business Intelligence
Professional Diploma in AI-Enabled Full-Stack Web Development
Advanced Certification in Data Analytics and Visualization
Advanced Certification in AI-Powered Web Development
Advanced Certification in Java Programming
Technical Fundamentals for Placements
Certificate Course in Dermatoglyphics
Placement Readiness & Employability Skills
Certificate in Python Programming
Certificate in C Programming
HR Analytics Essentials
Certificate in Data Analytics
Certificate in Java Programming
Certificate in AI-Enabled Web Technology
Integrated MPPSC Preparation Course
Certificate Course in Cell Biology
Experimental techniques in Biological Sciences
Certificate Course in Counselling Tools&Techniques
Certificate Course in Diagnostic Electrophoresis
Certificate Course in Mutation Research
Certificate Course in Clinical Microbiology
Basics of Python Programming for Pharmacy Students
Tribal Masks: A Reflection of India's Traditional Knowledge Systems
Transform technologies of Artificial Intelligence, Augmented Reality, Virtual Reality, and Mixed Reality
How Artificial Intelligence is Transforming Journalism and Performing Arts: Creativity vs Authenticity
Advanced Training in Laboratory Animal Handling and Preclinical Pharmacological Screening
Personality Development for Professionals
AgriXperience 1.0: Hands-On Training Agri- Lab Skills & Smart Tech
Fundamentals of Generative AI & Large Language Models(LLMs)
Cyber Law And Digital Security In India
Artificial Intelligence and Enhancing Communication Skills
AI for Budding Managers : Tools & Applications - module 2
Smart Infrastructure & Urban Planning Using AI
AI-Enabled Full Stack Development
AI-Based Virtual Assistants: Siri and Alexa
Structural and Material Engineering Using AI
Integrating Artificial Intelligence in Experimental Pharmacology: Bridging in Silico Prediction with in Vivo Validation
Python Basics to Brilliance: A Journey from Beginner to Confident Coder
Generative AI Lab: Create Smarter Systems and Smarter Ideas
AI Tools for Future Ready Management Smart Decision Making & Digital Leadership
AI-powered facial recognition
Emerging Trends in Cyber Security and Data Privacy
Mastering Power BI for Data Analytics
IOT Revolution Connecting the Future
Image Building & personality Devlopment
Industrial Automation & IIoT 4.0
Entrepreneurial Mindset and startup skills
Design in Pixels: Photoshop
API to Finished Product in Pharmaceutical Dosage Form
Java Foundations for Future Software Developers
Agentic AI: From Prompting to Autonomous Intelligence
Advanced Training Program on Drug Development and Analysis
Business Intelligence with Power BI
Robotics & AI
Recent Innovations in Electric Vehicle Design, Advanced Materials, and Manufacturing Technologies
Introduction to IoT: Concepts and Applications
AI in supply chain management
Python Ignite Program: Beginner to Project Builder
Digital Marketing
Learn Blockchain the Bitcoin Way
Power BI – Data to Dashboard
Machine Learning Applications with Agentic AI
CAD Verse: From Idea to Production
Recent Advancements in Cyber Forensics and Insurance Investigations
Next-Gen Embedded System Design
Master in Laravel with industry Expert
Generative AI Revolution: Transforming Ideas into Reality
Experimental Techniques in Biochemistry, Microbiology and Molecular Biology: A Practical Approach
Building Information Modeling (BIM) & Future Construction Technologies
Code Smart with Spring Boot
Internet of Things (IOT) based embedded system design
AI's Ascent: From Consumers to Creators
Bootcamp for Data Analysis: Python, NumPy, and Pandas
Introduction to Indian Knowledge System
Corporate Skill Required to Succeed After BBA
Change, Transformation and People: Navigating the Human Side of Organizational Evolution
Agentic AI
Data Analyst Master Class by Using Power BI, SQL, and MS Excel
Cell Biology
Instrumentation in Clinical Research
Integrating Digital Health and Telemedicine into Nursing Practice
Good Clinical Practice (GCP) & Good Laboratory Practice (GLP)
Fundamentals of Generative AI & prompt engineering
Indian Knowledge System in Banking & Finance: Tradition to Transformation
Skill Up With Income Tax Act 2025
Vocal Music Workshop With Creative Digital Notation
Entrepreneurial Mindset & Innovation Management
Full Stack Web Development with Python(Django, Flask & Fast API)
Pathways to Civil Services Examinations
Diagnostic Electrophoresis
Alternative Dispute Resolution: Law, Practice, and Emerging Trends in India.
Hands-on IoT Development using ESP8266 and Sensors
Clinical Microbiology
Competitive Programming
FutureAg: Advancing Agriculture for Tomorrow
Tide Turners: Innovations in Aquatic Science
Mutual Funds and Wealth Creation: Practical Perspectives
Hands on Training on Chromatographic and Spectroscopic Technique
Interactive Web Development with HTML, CSS & JavaScript
AI for Budding Managers : Tools and Application
Data Analysis Using Advanced Excel And AI
Communication Skills Talk to Masses
Leadership Skills by Shri N. Raghuraman
Project Design and Development
Artificial Intelligence (AI) Fundamentals & Prompt Engineering
Certificate Course in Dermatoglyphics
Certificate course in Counselling tools and Techniques
visa assistance intelligence visa guidance with AI agent
Green Biotech Skill Enhancement Course
Certificate Course in Mutation Research.
Certificate Course in Cell Biology
Applied Python: Build Applications & Solve Problems
transforming nursing through artificial intelligence, education -practice &innovation.
DATA ANALYSIS MASTERCLASS: FROM RAW DATA TO REAL INSIGHTS
HACKDEFEND: 15 DAYS TO CYBER ADVANCEMENT
Next Generation Biofertilizers & Biopesticide :Genomics-Driven Innovations for Sustainable Agriculture
Basics of Robotics & Artificial Intelligence
Women,Chidren & The New Criminal Laws:Understanding Protection, Rights and Reforms
Business Model Innovation and Startup Plan Development
Generative AI Lab: Create Smarter Systems and Smarter Ideas
AI tools for modern Business
Dance & Music
CERTIFICATION COURSE IN BANKING, FINANCE & INSURANCE
Marketing Accelator Series
Python with Power BI
CBT and Mindfulness-Based Emotional Wellbeing Program
The Art of Photography for Young Creators
Summer Sketch Fusion
Foundations of AI & Machine Learning
Mastering Core Java: Concepts to Code
AI/ML Using Python
AI, AR, VR Mixed Reality
AI in Real-World Applications & Data Science Techniques
From Zero to Hero - Mastering Ai with IOT
Impact of GST on Startup Growth and Compliance in India
Personality Development for Professionals
Data Analysis using advance Excel
Introduction to Advance concept of Block Chain Technology
Robotics AI Robotic arms and manipulators • End-effectors and grippers • Safety systems in industrial robots • Flexible automation and robotic cells • Industry 4.0 and smart manufacturing
MS Office for Everyone: Core Foundations & Practical Applications
Generative AI for business with Azure AI
AI-Driven Digital Marketing: Planning, Execution, and Optimization
Value Addition & Food Safet skill Development for New Age Entrepreneurs
Emotional Intelligence
Futuristic Project Based Learning using AI/ML
System Programming Using C
Programming Using C
NextGen Forensics Week: Innovate Investigate Inspire
Utilizations of Solid Works with 3D Printing
Web App development using Flutter
Essentials of Digital Marketing in Retail Business
Teacher Impact Program for Personal and Professional Growth
Visual Data Analytics with PowerBI
Transformative Developments in the Indian Criminal Justice System.
Technological Advancement for Agricultural Sustainability and Food Secruity
Hands On Training on Data Science & Machine Learning
7-Day Hands on Training Program in Electronics, Scientific Writing & Digital Literacy
INTEGRATED BUILDING DESIGN & BIM TOOLS TRAINING
AI for Creativity
GenAI Innovation Sprint
Traditional Home Remedies for common Aliment
Think in java logic coding
Agentic AI: Principles and Practice
Electric Vehicles installation and design
Python programming with AI tools
Opportunities in clinical research and Pharmacovigilience studies
INDUSTRY COLLABORATED HANDS-ON TRAINING IN TABLET FORMULATION AND QUALITY EVALUATION
Java Programming for Beginners
Use of Modern Software in Mechanical Engineering
Title of SWS Java Programming for Beginners
Corporate ethics & etiquettes
Data Visualization for Career Advancement
Data Science and Analytics: From Data to Decision-Making
Practical Accounting & Global Software Bootcamp
Formulate to Nourish: Pharma-Crafted Nutraceutical Delights
“Intellectual Property Rights in Academia: Legal Foundations, Emerging Trends, and Innovation-Driven Applications”
Smart Finance: Empowering Lives Through Financial Literacy
Tools and Techniques of AI and Cyber Security.
Photoshop Fundamentals: From Beginner to Pro
Software Developer Essentials
IOT & Robotics
Structure Biology and Bioinformatics
Power BI
Learn Cyber Security With hands on session on preventing cyber attacks
Soil Testing for Sustainable Agriculture: A Hands-On Training for Students and Agri-Entrepreneurs
Learn French Language With Us
Data Science & Visualization with Python
Startup & its Anticipatory Management
Use of AI in Civil Engineering
Bhartiya History & Present Scenario
NextGen Coders: Developing Future-Ready Applications
Mobile Application Development
Media and Different Art Forms
UI/UX Design
Crypto currency: Future Money
Microorganisms from Varied Habitats: Identification and Functional Analysis
Iot, Robotics & Mechatronics : Smart Future
Digital Trials in India : Legal Technological and Practical perspectives
Professional Grooming and Business Etiquette
Sales Strategy & Consumer Behaviour
The Role of Alternative Dispute Resolution in Modern Legal Systems
AI Based Electrical Tools
Penetration Testing with Windows
Zero to Hero: C++, DSA & Jobs
Data Forensics
PARAMPARA – A Summer Kathak Retreat
Generative AI Tools for Web development & Data Analytics
Mastering Quantitative & Qualitative Aptitude for MBA Placements: Cracking the Code to Corporate Success
Generative-Ai
Full Stack development with MERN Stack
Visual Merchandising and Supply Chain Management
Foundations of Retail Management
Store and Retail Operations Management
Industrial Automation With IOT
Application of Embedded in real life
Significance Role of 3D modeling Softwares (NX) for an Industrial applications
Omnichannel Retail Operations Management
LORA Protocol (long range wide area network)
Web Development Using React Framework
Android App Development
Web Application Development
Data Analytics with Power BI
The Role of Innovative Techniques in Boosting Agricultural Productivity
Color Theory Lab
Python with DSA
ESCALATE YOUR OFFICE SOFT SKILLS
Unlocking Fisheries: The Science behind the Sustainable practices
From Campus to Corporate: Personality Enrichment Program
Web Application Development using flutter
Pharmacovigilance: Measures to ensure drug safety
Disaster Management and Business Continuity Planning
How to file Income Tax Return for Salaried Person
Industrial Internet of Things (IIoT)
Innovative Drug Delivery : Design, Profiling and Potential of Novel Therapeutics
Python for Data Preprocessing: Shaping Data for Analysis
Quant to Qualify: The Ultimate Aptitude Series
Azure Machine Learning Studio
IoT and it's Applications
Basic AI Tools for Managers
Enhancing Power of Programming through Logic Building
Digital marketing and Social Media
Digital Branding for Startups: Build, Promote and Grow
Describe your Concern
Your Concern
Select Concern
Payment
Certificate
Registration / Login
Wrong Course Opted
Course
AI-Driven Computing and Algorithm Design Using DSA
Code Mastery With Springboot
Analytical Techniques Used in Screening of Herbal Drugs
Data Analysis Using Advanced Excel
Omnichannel Retail and CRM
Automation Fundamentals
Creative Learning, Mindful Productivity and Personality Development
Mission UPSC & MPPSC Selection – Are You Ready?
CAD to Career: Industry Oriented Auto CAD
Data Analysis Master Class from Raw Data Real Insights
Managerial Skills and AI Tools
IOT & Embedded System: Fundamentals and Applications
Certificate Course in Cell Biology
Generative AI and Large Language Models (LLMs)
Frontiers in Life Sciences: Technologies and Solutions for UN SDGs
Siemens NX: Industry-Oriented CAD Design and Manufacturing Application
Data Analysis With Power BI
CPCT Complete Preparation Program
Industrial Internet of Things (IIoT): Smart Sensors, Connected Devices
Applied DSA & Competitve Problem Solving
Design Beyond Limits: AutoCAD for Civil & Mechanical Engineers
RAG Workshop: Build AI Apps That Know Your Data
Use of AI in Civil Engineering.
AI application development using python
AI- Powered Computing and Future Technologies
AI in Action: Project-Based Learning in Intelligent Computing
Problem Solving with Java and DSA
Future with Machine Learning
AI Powered Web Application Development
Generative AI and AI Application Development
Hands-On Practice on UV and HPLC
Forensic Science, Digital Evidence and Criminal Trial Advocacy
Research and challenges of Research Integrity
Modern Tools for Web development.
Mastering JAVA:Object Oriented Programming and Application Development
Emerging Trends inPharmaceutical Chemistry:AI,Analytics&Sustainability
Horizon : Exploring Social Sciences Beyond Boundaries of Books
Build your Own Chatboat using Gen AI.
Creative Thinking Processes and Methods
Artificial Intelligence and Emerging Technologies
Broadcast Journalism, News Anchoring and Live Production
Internet of Things (IoT) and Smart Device Development
Climate Smart Agriculture
“Emerging Trends and Innovations in Agribusiness Management.”
Google Cloud Platform Foundation
Applied AI: Real World Application Development using AI
IOS App Design and Development
GenAI with OpenAI and Python
Impact of AI Adoption on Financial Performance and Managerial Effect
Clinical Edge blueprints on Clinical Trails and Pharmacovigilance
C++ and Object-Oriented Programming: Fundamental to Real World Project
From Design to Part: Hands-on CNC Machining and 3D Printing
AI For Every One Smart Work With Artificial Intelligence
Hands on Training on Advance Analytical Techniques
Digital Marketing Basics
Competitive Programming and Algorithmic Thinking
Generative AI_ Leadership Towards Tomorrow
20-Hour Industry-Oriented Training Program on Web Product Development
Tally Prime: From Basics to Advanced Accounting
Digital Commerce Economics and Revenue Optimization
Introduction to AWS Cloud-Based Machine Learning & Intelligent System
Legal Drafting, Pleading And Advocacy: From Theory to Practice
Certificate Course in Tally Prime and Business Accounting
Job Readiness and Career Skills
Robotics, Automation & IoT with Arduino and ESP32
Professional Diploma in Java Full-Stack Development
Professional Diploma in Python Programming and Application Development
Advanced Certification in Python for Data Analysis & Automation
Professional Diploma in Data Analytics and Business Intelligence
Professional Diploma in AI-Enabled Full-Stack Web Development
Advanced Certification in Data Analytics and Visualization
Advanced Certification in AI-Powered Web Development
Advanced Certification in Java Programming
Technical Fundamentals for Placements
Certificate Course in Dermatoglyphics
Placement Readiness & Employability Skills
Certificate in Python Programming
Certificate in C Programming
HR Analytics Essentials
Certificate in Data Analytics
Certificate in Java Programming
Certificate in AI-Enabled Web Technology
Integrated MPPSC Preparation Course
Certificate Course in Cell Biology
Experimental techniques in Biological Sciences
Certificate Course in Counselling Tools&Techniques
Certificate Course in Diagnostic Electrophoresis
Certificate Course in Mutation Research
Certificate Course in Clinical Microbiology
Basics of Python Programming for Pharmacy Students
Tribal Masks: A Reflection of India's Traditional Knowledge Systems
Transform technologies of Artificial Intelligence, Augmented Reality, Virtual Reality, and Mixed Reality
How Artificial Intelligence is Transforming Journalism and Performing Arts: Creativity vs Authenticity
Advanced Training in Laboratory Animal Handling and Preclinical Pharmacological Screening
Personality Development for Professionals
AgriXperience 1.0: Hands-On Training Agri- Lab Skills & Smart Tech
Fundamentals of Generative AI & Large Language Models(LLMs)
Cyber Law And Digital Security In India
Artificial Intelligence and Enhancing Communication Skills
AI for Budding Managers : Tools & Applications - module 2
Smart Infrastructure & Urban Planning Using AI
AI-Enabled Full Stack Development
AI-Based Virtual Assistants: Siri and Alexa
Structural and Material Engineering Using AI
Integrating Artificial Intelligence in Experimental Pharmacology: Bridging in Silico Prediction with in Vivo Validation
Python Basics to Brilliance: A Journey from Beginner to Confident Coder
Generative AI Lab: Create Smarter Systems and Smarter Ideas
AI Tools for Future Ready Management Smart Decision Making & Digital Leadership
AI-powered facial recognition
Emerging Trends in Cyber Security and Data Privacy
Mastering Power BI for Data Analytics
IOT Revolution Connecting the Future
Image Building & personality Devlopment
Industrial Automation & IIoT 4.0
Entrepreneurial Mindset and startup skills
Design in Pixels: Photoshop
API to Finished Product in Pharmaceutical Dosage Form
Java Foundations for Future Software Developers
Agentic AI: From Prompting to Autonomous Intelligence
Advanced Training Program on Drug Development and Analysis
Business Intelligence with Power BI
Robotics & AI
Recent Innovations in Electric Vehicle Design, Advanced Materials, and Manufacturing Technologies
Introduction to IoT: Concepts and Applications
AI in supply chain management
Python Ignite Program: Beginner to Project Builder
Digital Marketing
Learn Blockchain the Bitcoin Way
Power BI – Data to Dashboard
Machine Learning Applications with Agentic AI
CAD Verse: From Idea to Production
Recent Advancements in Cyber Forensics and Insurance Investigations
Next-Gen Embedded System Design
Master in Laravel with industry Expert
Generative AI Revolution: Transforming Ideas into Reality
Experimental Techniques in Biochemistry, Microbiology and Molecular Biology: A Practical Approach
Building Information Modeling (BIM) & Future Construction Technologies
Code Smart with Spring Boot
Internet of Things (IOT) based embedded system design
AI's Ascent: From Consumers to Creators
Bootcamp for Data Analysis: Python, NumPy, and Pandas
Introduction to Indian Knowledge System
Corporate Skill Required to Succeed After BBA
Change, Transformation and People: Navigating the Human Side of Organizational Evolution
Agentic AI
Data Analyst Master Class by Using Power BI, SQL, and MS Excel
Cell Biology
Instrumentation in Clinical Research
Integrating Digital Health and Telemedicine into Nursing Practice
Good Clinical Practice (GCP) & Good Laboratory Practice (GLP)
Fundamentals of Generative AI & prompt engineering
Indian Knowledge System in Banking & Finance: Tradition to Transformation
Skill Up With Income Tax Act 2025
Vocal Music Workshop With Creative Digital Notation
Entrepreneurial Mindset & Innovation Management
Full Stack Web Development with Python(Django, Flask & Fast API)
Pathways to Civil Services Examinations
Diagnostic Electrophoresis
Alternative Dispute Resolution: Law, Practice, and Emerging Trends in India.
Hands-on IoT Development using ESP8266 and Sensors
Clinical Microbiology
Competitive Programming
FutureAg: Advancing Agriculture for Tomorrow
Tide Turners: Innovations in Aquatic Science
Mutual Funds and Wealth Creation: Practical Perspectives
Hands on Training on Chromatographic and Spectroscopic Technique
Interactive Web Development with HTML, CSS & JavaScript
AI for Budding Managers : Tools and Application
Data Analysis Using Advanced Excel And AI
Communication Skills Talk to Masses
Leadership Skills by Shri N. Raghuraman
Project Design and Development
Artificial Intelligence (AI) Fundamentals & Prompt Engineering
Certificate Course in Dermatoglyphics
Certificate course in Counselling tools and Techniques
visa assistance intelligence visa guidance with AI agent
Green Biotech Skill Enhancement Course
Certificate Course in Mutation Research.
Certificate Course in Cell Biology
Applied Python: Build Applications & Solve Problems
transforming nursing through artificial intelligence, education -practice &innovation.
DATA ANALYSIS MASTERCLASS: FROM RAW DATA TO REAL INSIGHTS
HACKDEFEND: 15 DAYS TO CYBER ADVANCEMENT
Next Generation Biofertilizers & Biopesticide :Genomics-Driven Innovations for Sustainable Agriculture
Basics of Robotics & Artificial Intelligence
Women,Chidren & The New Criminal Laws:Understanding Protection, Rights and Reforms
Business Model Innovation and Startup Plan Development
Generative AI Lab: Create Smarter Systems and Smarter Ideas
AI tools for modern Business
Dance & Music
CERTIFICATION COURSE IN BANKING, FINANCE & INSURANCE
Marketing Accelator Series
Python with Power BI
CBT and Mindfulness-Based Emotional Wellbeing Program
The Art of Photography for Young Creators
Summer Sketch Fusion
Foundations of AI & Machine Learning
Mastering Core Java: Concepts to Code
AI/ML Using Python
AI, AR, VR Mixed Reality
AI in Real-World Applications & Data Science Techniques
From Zero to Hero - Mastering Ai with IOT
Impact of GST on Startup Growth and Compliance in India
Personality Development for Professionals
Data Analysis using advance Excel
Introduction to Advance concept of Block Chain Technology
Robotics AI Robotic arms and manipulators • End-effectors and grippers • Safety systems in industrial robots • Flexible automation and robotic cells • Industry 4.0 and smart manufacturing
MS Office for Everyone: Core Foundations & Practical Applications
Generative AI for business with Azure AI
AI-Driven Digital Marketing: Planning, Execution, and Optimization
Value Addition & Food Safet skill Development for New Age Entrepreneurs
Emotional Intelligence
Futuristic Project Based Learning using AI/ML
System Programming Using C
Programming Using C
NextGen Forensics Week: Innovate Investigate Inspire
Utilizations of Solid Works with 3D Printing
Web App development using Flutter
Essentials of Digital Marketing in Retail Business
Teacher Impact Program for Personal and Professional Growth
Visual Data Analytics with PowerBI
Transformative Developments in the Indian Criminal Justice System.
Technological Advancement for Agricultural Sustainability and Food Secruity
Hands On Training on Data Science & Machine Learning
7-Day Hands on Training Program in Electronics, Scientific Writing & Digital Literacy
INTEGRATED BUILDING DESIGN & BIM TOOLS TRAINING
AI for Creativity
GenAI Innovation Sprint
Traditional Home Remedies for common Aliment
Think in java logic coding
Agentic AI: Principles and Practice
Electric Vehicles installation and design
Python programming with AI tools
Opportunities in clinical research and Pharmacovigilience studies
INDUSTRY COLLABORATED HANDS-ON TRAINING IN TABLET FORMULATION AND QUALITY EVALUATION
Java Programming for Beginners
Use of Modern Software in Mechanical Engineering
Title of SWS Java Programming for Beginners
Corporate ethics & etiquettes
Data Visualization for Career Advancement
Data Science and Analytics: From Data to Decision-Making
Practical Accounting & Global Software Bootcamp
Formulate to Nourish: Pharma-Crafted Nutraceutical Delights
“Intellectual Property Rights in Academia: Legal Foundations, Emerging Trends, and Innovation-Driven Applications”
Smart Finance: Empowering Lives Through Financial Literacy
Tools and Techniques of AI and Cyber Security.
Photoshop Fundamentals: From Beginner to Pro
Software Developer Essentials
IOT & Robotics
Structure Biology and Bioinformatics
Power BI
Learn Cyber Security With hands on session on preventing cyber attacks
Soil Testing for Sustainable Agriculture: A Hands-On Training for Students and Agri-Entrepreneurs
Learn French Language With Us
Data Science & Visualization with Python
Startup & its Anticipatory Management
Use of AI in Civil Engineering
Bhartiya History & Present Scenario
NextGen Coders: Developing Future-Ready Applications
Mobile Application Development
Media and Different Art Forms
UI/UX Design
Crypto currency: Future Money
Microorganisms from Varied Habitats: Identification and Functional Analysis
Iot, Robotics & Mechatronics : Smart Future
Digital Trials in India : Legal Technological and Practical perspectives
Professional Grooming and Business Etiquette
Sales Strategy & Consumer Behaviour
The Role of Alternative Dispute Resolution in Modern Legal Systems
AI Based Electrical Tools
Penetration Testing with Windows
Zero to Hero: C++, DSA & Jobs
Data Forensics
PARAMPARA – A Summer Kathak Retreat
Generative AI Tools for Web development & Data Analytics
Mastering Quantitative & Qualitative Aptitude for MBA Placements: Cracking the Code to Corporate Success
Generative-Ai
Full Stack development with MERN Stack
Visual Merchandising and Supply Chain Management
Foundations of Retail Management
Store and Retail Operations Management
Industrial Automation With IOT
Application of Embedded in real life
Significance Role of 3D modeling Softwares (NX) for an Industrial applications
Omnichannel Retail Operations Management
LORA Protocol (long range wide area network)
Web Development Using React Framework
Android App Development
Web Application Development
Data Analytics with Power BI
The Role of Innovative Techniques in Boosting Agricultural Productivity
Color Theory Lab
Python with DSA
ESCALATE YOUR OFFICE SOFT SKILLS
Unlocking Fisheries: The Science behind the Sustainable practices
From Campus to Corporate: Personality Enrichment Program
Web Application Development using flutter
Pharmacovigilance: Measures to ensure drug safety
Disaster Management and Business Continuity Planning
How to file Income Tax Return for Salaried Person
Industrial Internet of Things (IIoT)
Innovative Drug Delivery : Design, Profiling and Potential of Novel Therapeutics
Python for Data Preprocessing: Shaping Data for Analysis
Quant to Qualify: The Ultimate Aptitude Series
Azure Machine Learning Studio
IoT and it's Applications
Basic AI Tools for Managers
Enhancing Power of Programming through Logic Building
Digital marketing and Social Media
Digital Branding for Startups: Build, Promote and Grow
Wrong Course Selected
AI-Driven Computing and Algorithm Design Using DSA
Code Mastery With Springboot
Analytical Techniques Used in Screening of Herbal Drugs
Data Analysis Using Advanced Excel
Omnichannel Retail and CRM
Automation Fundamentals
Creative Learning, Mindful Productivity and Personality Development
Mission UPSC & MPPSC Selection – Are You Ready?
CAD to Career: Industry Oriented Auto CAD
Data Analysis Master Class from Raw Data Real Insights
Managerial Skills and AI Tools
IOT & Embedded System: Fundamentals and Applications
Certificate Course in Cell Biology
Generative AI and Large Language Models (LLMs)
Frontiers in Life Sciences: Technologies and Solutions for UN SDGs
Siemens NX: Industry-Oriented CAD Design and Manufacturing Application
Data Analysis With Power BI
CPCT Complete Preparation Program
Industrial Internet of Things (IIoT): Smart Sensors, Connected Devices
Applied DSA & Competitve Problem Solving
Design Beyond Limits: AutoCAD for Civil & Mechanical Engineers
RAG Workshop: Build AI Apps That Know Your Data
Use of AI in Civil Engineering.
AI application development using python
AI- Powered Computing and Future Technologies
AI in Action: Project-Based Learning in Intelligent Computing
Problem Solving with Java and DSA
Future with Machine Learning
AI Powered Web Application Development
Generative AI and AI Application Development
Hands-On Practice on UV and HPLC
Forensic Science, Digital Evidence and Criminal Trial Advocacy
Research and challenges of Research Integrity
Modern Tools for Web development.
Mastering JAVA:Object Oriented Programming and Application Development
Emerging Trends inPharmaceutical Chemistry:AI,Analytics&Sustainability
Horizon : Exploring Social Sciences Beyond Boundaries of Books
Build your Own Chatboat using Gen AI.
Creative Thinking Processes and Methods
Artificial Intelligence and Emerging Technologies
Broadcast Journalism, News Anchoring and Live Production
Internet of Things (IoT) and Smart Device Development
Climate Smart Agriculture
“Emerging Trends and Innovations in Agribusiness Management.”
Google Cloud Platform Foundation
Applied AI: Real World Application Development using AI
IOS App Design and Development
GenAI with OpenAI and Python
Impact of AI Adoption on Financial Performance and Managerial Effect
Clinical Edge blueprints on Clinical Trails and Pharmacovigilance
C++ and Object-Oriented Programming: Fundamental to Real World Project
From Design to Part: Hands-on CNC Machining and 3D Printing
AI For Every One Smart Work With Artificial Intelligence
Hands on Training on Advance Analytical Techniques
Digital Marketing Basics
Competitive Programming and Algorithmic Thinking
Generative AI_ Leadership Towards Tomorrow
20-Hour Industry-Oriented Training Program on Web Product Development
Tally Prime: From Basics to Advanced Accounting
Digital Commerce Economics and Revenue Optimization
Introduction to AWS Cloud-Based Machine Learning & Intelligent System
Legal Drafting, Pleading And Advocacy: From Theory to Practice
Certificate Course in Tally Prime and Business Accounting
Job Readiness and Career Skills
Robotics, Automation & IoT with Arduino and ESP32
Professional Diploma in Java Full-Stack Development
Professional Diploma in Python Programming and Application Development
Advanced Certification in Python for Data Analysis & Automation
Professional Diploma in Data Analytics and Business Intelligence
Professional Diploma in AI-Enabled Full-Stack Web Development
Advanced Certification in Data Analytics and Visualization
Advanced Certification in AI-Powered Web Development
Advanced Certification in Java Programming
Technical Fundamentals for Placements
Certificate Course in Dermatoglyphics
Placement Readiness & Employability Skills
Certificate in Python Programming
Certificate in C Programming
HR Analytics Essentials
Certificate in Data Analytics
Certificate in Java Programming
Certificate in AI-Enabled Web Technology
Integrated MPPSC Preparation Course
Certificate Course in Cell Biology
Experimental techniques in Biological Sciences
Certificate Course in Counselling Tools&Techniques
Certificate Course in Diagnostic Electrophoresis
Certificate Course in Mutation Research
Certificate Course in Clinical Microbiology
Basics of Python Programming for Pharmacy Students
Tribal Masks: A Reflection of India's Traditional Knowledge Systems
Transform technologies of Artificial Intelligence, Augmented Reality, Virtual Reality, and Mixed Reality
How Artificial Intelligence is Transforming Journalism and Performing Arts: Creativity vs Authenticity
Advanced Training in Laboratory Animal Handling and Preclinical Pharmacological Screening
Personality Development for Professionals
AgriXperience 1.0: Hands-On Training Agri- Lab Skills & Smart Tech
Fundamentals of Generative AI & Large Language Models(LLMs)
Cyber Law And Digital Security In India
Artificial Intelligence and Enhancing Communication Skills
AI for Budding Managers : Tools & Applications - module 2
Smart Infrastructure & Urban Planning Using AI
AI-Enabled Full Stack Development
AI-Based Virtual Assistants: Siri and Alexa
Structural and Material Engineering Using AI
Integrating Artificial Intelligence in Experimental Pharmacology: Bridging in Silico Prediction with in Vivo Validation
Python Basics to Brilliance: A Journey from Beginner to Confident Coder
Generative AI Lab: Create Smarter Systems and Smarter Ideas
AI Tools for Future Ready Management Smart Decision Making & Digital Leadership
AI-powered facial recognition
Emerging Trends in Cyber Security and Data Privacy
Mastering Power BI for Data Analytics
IOT Revolution Connecting the Future
Image Building & personality Devlopment
Industrial Automation & IIoT 4.0
Entrepreneurial Mindset and startup skills
Design in Pixels: Photoshop
API to Finished Product in Pharmaceutical Dosage Form
Java Foundations for Future Software Developers
Agentic AI: From Prompting to Autonomous Intelligence
Advanced Training Program on Drug Development and Analysis
Business Intelligence with Power BI
Robotics & AI
Recent Innovations in Electric Vehicle Design, Advanced Materials, and Manufacturing Technologies
Introduction to IoT: Concepts and Applications
AI in supply chain management
Python Ignite Program: Beginner to Project Builder
Digital Marketing
Learn Blockchain the Bitcoin Way
Power BI – Data to Dashboard
Machine Learning Applications with Agentic AI
CAD Verse: From Idea to Production
Recent Advancements in Cyber Forensics and Insurance Investigations
Next-Gen Embedded System Design
Master in Laravel with industry Expert
Generative AI Revolution: Transforming Ideas into Reality
Experimental Techniques in Biochemistry, Microbiology and Molecular Biology: A Practical Approach
Building Information Modeling (BIM) & Future Construction Technologies
Code Smart with Spring Boot
Internet of Things (IOT) based embedded system design
AI's Ascent: From Consumers to Creators
Bootcamp for Data Analysis: Python, NumPy, and Pandas
Introduction to Indian Knowledge System
Corporate Skill Required to Succeed After BBA
Change, Transformation and People: Navigating the Human Side of Organizational Evolution
Agentic AI
Data Analyst Master Class by Using Power BI, SQL, and MS Excel
Cell Biology
Instrumentation in Clinical Research
Integrating Digital Health and Telemedicine into Nursing Practice
Good Clinical Practice (GCP) & Good Laboratory Practice (GLP)
Fundamentals of Generative AI & prompt engineering
Indian Knowledge System in Banking & Finance: Tradition to Transformation
Skill Up With Income Tax Act 2025
Vocal Music Workshop With Creative Digital Notation
Entrepreneurial Mindset & Innovation Management
Full Stack Web Development with Python(Django, Flask & Fast API)
Pathways to Civil Services Examinations
Diagnostic Electrophoresis
Alternative Dispute Resolution: Law, Practice, and Emerging Trends in India.
Hands-on IoT Development using ESP8266 and Sensors
Clinical Microbiology
Competitive Programming
FutureAg: Advancing Agriculture for Tomorrow
Tide Turners: Innovations in Aquatic Science
Mutual Funds and Wealth Creation: Practical Perspectives
Hands on Training on Chromatographic and Spectroscopic Technique
Interactive Web Development with HTML, CSS & JavaScript
AI for Budding Managers : Tools and Application
Data Analysis Using Advanced Excel And AI
Communication Skills Talk to Masses
Leadership Skills by Shri N. Raghuraman
Project Design and Development
Artificial Intelligence (AI) Fundamentals & Prompt Engineering
Certificate Course in Dermatoglyphics
Certificate course in Counselling tools and Techniques
visa assistance intelligence visa guidance with AI agent
Green Biotech Skill Enhancement Course
Certificate Course in Mutation Research.
Certificate Course in Cell Biology
Applied Python: Build Applications & Solve Problems
transforming nursing through artificial intelligence, education -practice &innovation.
DATA ANALYSIS MASTERCLASS: FROM RAW DATA TO REAL INSIGHTS
HACKDEFEND: 15 DAYS TO CYBER ADVANCEMENT
Next Generation Biofertilizers & Biopesticide :Genomics-Driven Innovations for Sustainable Agriculture
Basics of Robotics & Artificial Intelligence
Women,Chidren & The New Criminal Laws:Understanding Protection, Rights and Reforms
Business Model Innovation and Startup Plan Development
Generative AI Lab: Create Smarter Systems and Smarter Ideas
AI tools for modern Business
Dance & Music
CERTIFICATION COURSE IN BANKING, FINANCE & INSURANCE
Marketing Accelator Series
Python with Power BI
CBT and Mindfulness-Based Emotional Wellbeing Program
The Art of Photography for Young Creators
Summer Sketch Fusion
Foundations of AI & Machine Learning
Mastering Core Java: Concepts to Code
AI/ML Using Python
AI, AR, VR Mixed Reality
AI in Real-World Applications & Data Science Techniques
From Zero to Hero - Mastering Ai with IOT
Impact of GST on Startup Growth and Compliance in India
Personality Development for Professionals
Data Analysis using advance Excel
Introduction to Advance concept of Block Chain Technology
Robotics AI Robotic arms and manipulators • End-effectors and grippers • Safety systems in industrial robots • Flexible automation and robotic cells • Industry 4.0 and smart manufacturing
MS Office for Everyone: Core Foundations & Practical Applications
Generative AI for business with Azure AI
AI-Driven Digital Marketing: Planning, Execution, and Optimization
Value Addition & Food Safet skill Development for New Age Entrepreneurs
Emotional Intelligence
Futuristic Project Based Learning using AI/ML
System Programming Using C
Programming Using C
NextGen Forensics Week: Innovate Investigate Inspire
Utilizations of Solid Works with 3D Printing
Web App development using Flutter
Essentials of Digital Marketing in Retail Business
Teacher Impact Program for Personal and Professional Growth
Visual Data Analytics with PowerBI
Transformative Developments in the Indian Criminal Justice System.
Technological Advancement for Agricultural Sustainability and Food Secruity
Hands On Training on Data Science & Machine Learning
7-Day Hands on Training Program in Electronics, Scientific Writing & Digital Literacy
INTEGRATED BUILDING DESIGN & BIM TOOLS TRAINING
AI for Creativity
GenAI Innovation Sprint
Traditional Home Remedies for common Aliment
Think in java logic coding
Agentic AI: Principles and Practice
Electric Vehicles installation and design
Python programming with AI tools
Opportunities in clinical research and Pharmacovigilience studies
INDUSTRY COLLABORATED HANDS-ON TRAINING IN TABLET FORMULATION AND QUALITY EVALUATION
Java Programming for Beginners
Use of Modern Software in Mechanical Engineering
Title of SWS Java Programming for Beginners
Corporate ethics & etiquettes
Data Visualization for Career Advancement
Data Science and Analytics: From Data to Decision-Making
Practical Accounting & Global Software Bootcamp
Formulate to Nourish: Pharma-Crafted Nutraceutical Delights
“Intellectual Property Rights in Academia: Legal Foundations, Emerging Trends, and Innovation-Driven Applications”
Smart Finance: Empowering Lives Through Financial Literacy
Tools and Techniques of AI and Cyber Security.
Photoshop Fundamentals: From Beginner to Pro
Software Developer Essentials
IOT & Robotics
Structure Biology and Bioinformatics
Power BI
Learn Cyber Security With hands on session on preventing cyber attacks
Soil Testing for Sustainable Agriculture: A Hands-On Training for Students and Agri-Entrepreneurs
Learn French Language With Us
Data Science & Visualization with Python
Startup & its Anticipatory Management
Use of AI in Civil Engineering
Bhartiya History & Present Scenario
NextGen Coders: Developing Future-Ready Applications
Mobile Application Development
Media and Different Art Forms
UI/UX Design
Crypto currency: Future Money
Microorganisms from Varied Habitats: Identification and Functional Analysis
Iot, Robotics & Mechatronics : Smart Future
Digital Trials in India : Legal Technological and Practical perspectives
Professional Grooming and Business Etiquette
Sales Strategy & Consumer Behaviour
The Role of Alternative Dispute Resolution in Modern Legal Systems
AI Based Electrical Tools
Penetration Testing with Windows
Zero to Hero: C++, DSA & Jobs
Data Forensics
PARAMPARA – A Summer Kathak Retreat
Generative AI Tools for Web development & Data Analytics
Mastering Quantitative & Qualitative Aptitude for MBA Placements: Cracking the Code to Corporate Success
Generative-Ai
Full Stack development with MERN Stack
Visual Merchandising and Supply Chain Management
Foundations of Retail Management
Store and Retail Operations Management
Industrial Automation With IOT
Application of Embedded in real life
Significance Role of 3D modeling Softwares (NX) for an Industrial applications
Omnichannel Retail Operations Management
LORA Protocol (long range wide area network)
Web Development Using React Framework
Android App Development
Web Application Development
Data Analytics with Power BI
The Role of Innovative Techniques in Boosting Agricultural Productivity
Color Theory Lab
Python with DSA
ESCALATE YOUR OFFICE SOFT SKILLS
Unlocking Fisheries: The Science behind the Sustainable practices
From Campus to Corporate: Personality Enrichment Program
Web Application Development using flutter
Pharmacovigilance: Measures to ensure drug safety
Disaster Management and Business Continuity Planning
How to file Income Tax Return for Salaried Person
Industrial Internet of Things (IIoT)
Innovative Drug Delivery : Design, Profiling and Potential of Novel Therapeutics
Python for Data Preprocessing: Shaping Data for Analysis
Quant to Qualify: The Ultimate Aptitude Series
Azure Machine Learning Studio
IoT and it's Applications
Basic AI Tools for Managers
Enhancing Power of Programming through Logic Building
Digital marketing and Social Media
Digital Branding for Startups: Build, Promote and Grow
Course To Transfer
AI-Driven Computing and Algorithm Design Using DSA
Code Mastery With Springboot
Analytical Techniques Used in Screening of Herbal Drugs
Data Analysis Using Advanced Excel
Omnichannel Retail and CRM
Automation Fundamentals
Creative Learning, Mindful Productivity and Personality Development
Mission UPSC & MPPSC Selection – Are You Ready?
CAD to Career: Industry Oriented Auto CAD
Data Analysis Master Class from Raw Data Real Insights
Managerial Skills and AI Tools
IOT & Embedded System: Fundamentals and Applications
Certificate Course in Cell Biology
Generative AI and Large Language Models (LLMs)
Frontiers in Life Sciences: Technologies and Solutions for UN SDGs
Siemens NX: Industry-Oriented CAD Design and Manufacturing Application
Data Analysis With Power BI
CPCT Complete Preparation Program
Industrial Internet of Things (IIoT): Smart Sensors, Connected Devices
Applied DSA & Competitve Problem Solving
Design Beyond Limits: AutoCAD for Civil & Mechanical Engineers
RAG Workshop: Build AI Apps That Know Your Data
Use of AI in Civil Engineering.
AI application development using python
AI- Powered Computing and Future Technologies
AI in Action: Project-Based Learning in Intelligent Computing
Problem Solving with Java and DSA
Future with Machine Learning
AI Powered Web Application Development
Generative AI and AI Application Development
Hands-On Practice on UV and HPLC
Forensic Science, Digital Evidence and Criminal Trial Advocacy
Research and challenges of Research Integrity
Modern Tools for Web development.
Mastering JAVA:Object Oriented Programming and Application Development
Emerging Trends inPharmaceutical Chemistry:AI,Analytics&Sustainability
Horizon : Exploring Social Sciences Beyond Boundaries of Books
Build your Own Chatboat using Gen AI.
Creative Thinking Processes and Methods
Artificial Intelligence and Emerging Technologies
Broadcast Journalism, News Anchoring and Live Production
Internet of Things (IoT) and Smart Device Development
Climate Smart Agriculture
“Emerging Trends and Innovations in Agribusiness Management.”
Google Cloud Platform Foundation
Applied AI: Real World Application Development using AI
IOS App Design and Development
GenAI with OpenAI and Python
Impact of AI Adoption on Financial Performance and Managerial Effect
Clinical Edge blueprints on Clinical Trails and Pharmacovigilance
C++ and Object-Oriented Programming: Fundamental to Real World Project
From Design to Part: Hands-on CNC Machining and 3D Printing
AI For Every One Smart Work With Artificial Intelligence
Hands on Training on Advance Analytical Techniques
Digital Marketing Basics
Competitive Programming and Algorithmic Thinking
Generative AI_ Leadership Towards Tomorrow
20-Hour Industry-Oriented Training Program on Web Product Development
Tally Prime: From Basics to Advanced Accounting
Digital Commerce Economics and Revenue Optimization
Introduction to AWS Cloud-Based Machine Learning & Intelligent System
Legal Drafting, Pleading And Advocacy: From Theory to Practice
Certificate Course in Tally Prime and Business Accounting
Job Readiness and Career Skills
Robotics, Automation & IoT with Arduino and ESP32
Professional Diploma in Java Full-Stack Development
Professional Diploma in Python Programming and Application Development
Advanced Certification in Python for Data Analysis & Automation
Professional Diploma in Data Analytics and Business Intelligence
Professional Diploma in AI-Enabled Full-Stack Web Development
Advanced Certification in Data Analytics and Visualization
Advanced Certification in AI-Powered Web Development
Advanced Certification in Java Programming
Technical Fundamentals for Placements
Certificate Course in Dermatoglyphics
Placement Readiness & Employability Skills
Certificate in Python Programming
Certificate in C Programming
HR Analytics Essentials
Certificate in Data Analytics
Certificate in Java Programming
Certificate in AI-Enabled Web Technology
Integrated MPPSC Preparation Course
Certificate Course in Cell Biology
Experimental techniques in Biological Sciences
Certificate Course in Counselling Tools&Techniques
Certificate Course in Diagnostic Electrophoresis
Certificate Course in Mutation Research
Certificate Course in Clinical Microbiology
Basics of Python Programming for Pharmacy Students
Tribal Masks: A Reflection of India's Traditional Knowledge Systems
Transform technologies of Artificial Intelligence, Augmented Reality, Virtual Reality, and Mixed Reality
How Artificial Intelligence is Transforming Journalism and Performing Arts: Creativity vs Authenticity
Advanced Training in Laboratory Animal Handling and Preclinical Pharmacological Screening
Personality Development for Professionals
AgriXperience 1.0: Hands-On Training Agri- Lab Skills & Smart Tech
Fundamentals of Generative AI & Large Language Models(LLMs)
Cyber Law And Digital Security In India
Artificial Intelligence and Enhancing Communication Skills
AI for Budding Managers : Tools & Applications - module 2
Smart Infrastructure & Urban Planning Using AI
AI-Enabled Full Stack Development
AI-Based Virtual Assistants: Siri and Alexa
Structural and Material Engineering Using AI
Integrating Artificial Intelligence in Experimental Pharmacology: Bridging in Silico Prediction with in Vivo Validation
Python Basics to Brilliance: A Journey from Beginner to Confident Coder
Generative AI Lab: Create Smarter Systems and Smarter Ideas
AI Tools for Future Ready Management Smart Decision Making & Digital Leadership
AI-powered facial recognition
Emerging Trends in Cyber Security and Data Privacy
Mastering Power BI for Data Analytics
IOT Revolution Connecting the Future
Image Building & personality Devlopment
Industrial Automation & IIoT 4.0
Entrepreneurial Mindset and startup skills
Design in Pixels: Photoshop
API to Finished Product in Pharmaceutical Dosage Form
Java Foundations for Future Software Developers
Agentic AI: From Prompting to Autonomous Intelligence
Advanced Training Program on Drug Development and Analysis
Business Intelligence with Power BI
Robotics & AI
Recent Innovations in Electric Vehicle Design, Advanced Materials, and Manufacturing Technologies
Introduction to IoT: Concepts and Applications
AI in supply chain management
Python Ignite Program: Beginner to Project Builder
Digital Marketing
Learn Blockchain the Bitcoin Way
Power BI – Data to Dashboard
Machine Learning Applications with Agentic AI
CAD Verse: From Idea to Production
Recent Advancements in Cyber Forensics and Insurance Investigations
Next-Gen Embedded System Design
Master in Laravel with industry Expert
Generative AI Revolution: Transforming Ideas into Reality
Experimental Techniques in Biochemistry, Microbiology and Molecular Biology: A Practical Approach
Building Information Modeling (BIM) & Future Construction Technologies
Code Smart with Spring Boot
Internet of Things (IOT) based embedded system design
AI's Ascent: From Consumers to Creators
Bootcamp for Data Analysis: Python, NumPy, and Pandas
Introduction to Indian Knowledge System
Corporate Skill Required to Succeed After BBA
Change, Transformation and People: Navigating the Human Side of Organizational Evolution
Agentic AI
Data Analyst Master Class by Using Power BI, SQL, and MS Excel
Cell Biology
Instrumentation in Clinical Research
Integrating Digital Health and Telemedicine into Nursing Practice
Good Clinical Practice (GCP) & Good Laboratory Practice (GLP)
Fundamentals of Generative AI & prompt engineering
Indian Knowledge System in Banking & Finance: Tradition to Transformation
Skill Up With Income Tax Act 2025
Vocal Music Workshop With Creative Digital Notation
Entrepreneurial Mindset & Innovation Management
Full Stack Web Development with Python(Django, Flask & Fast API)
Pathways to Civil Services Examinations
Diagnostic Electrophoresis
Alternative Dispute Resolution: Law, Practice, and Emerging Trends in India.
Hands-on IoT Development using ESP8266 and Sensors
Clinical Microbiology
Competitive Programming
FutureAg: Advancing Agriculture for Tomorrow
Tide Turners: Innovations in Aquatic Science
Mutual Funds and Wealth Creation: Practical Perspectives
Hands on Training on Chromatographic and Spectroscopic Technique
Interactive Web Development with HTML, CSS & JavaScript
AI for Budding Managers : Tools and Application
Data Analysis Using Advanced Excel And AI
Communication Skills Talk to Masses
Leadership Skills by Shri N. Raghuraman
Project Design and Development
Artificial Intelligence (AI) Fundamentals & Prompt Engineering
Certificate Course in Dermatoglyphics
Certificate course in Counselling tools and Techniques
visa assistance intelligence visa guidance with AI agent
Green Biotech Skill Enhancement Course
Certificate Course in Mutation Research.
Certificate Course in Cell Biology
Applied Python: Build Applications & Solve Problems
transforming nursing through artificial intelligence, education -practice &innovation.
DATA ANALYSIS MASTERCLASS: FROM RAW DATA TO REAL INSIGHTS
HACKDEFEND: 15 DAYS TO CYBER ADVANCEMENT
Next Generation Biofertilizers & Biopesticide :Genomics-Driven Innovations for Sustainable Agriculture
Basics of Robotics & Artificial Intelligence
Women,Chidren & The New Criminal Laws:Understanding Protection, Rights and Reforms
Business Model Innovation and Startup Plan Development
Generative AI Lab: Create Smarter Systems and Smarter Ideas
AI tools for modern Business
Dance & Music
CERTIFICATION COURSE IN BANKING, FINANCE & INSURANCE
Marketing Accelator Series
Python with Power BI
CBT and Mindfulness-Based Emotional Wellbeing Program
The Art of Photography for Young Creators
Summer Sketch Fusion
Foundations of AI & Machine Learning
Mastering Core Java: Concepts to Code
AI/ML Using Python
AI, AR, VR Mixed Reality
AI in Real-World Applications & Data Science Techniques
From Zero to Hero - Mastering Ai with IOT
Impact of GST on Startup Growth and Compliance in India
Personality Development for Professionals
Data Analysis using advance Excel
Introduction to Advance concept of Block Chain Technology
Robotics AI Robotic arms and manipulators • End-effectors and grippers • Safety systems in industrial robots • Flexible automation and robotic cells • Industry 4.0 and smart manufacturing
MS Office for Everyone: Core Foundations & Practical Applications
Generative AI for business with Azure AI
AI-Driven Digital Marketing: Planning, Execution, and Optimization
Value Addition & Food Safet skill Development for New Age Entrepreneurs
Emotional Intelligence
Futuristic Project Based Learning using AI/ML
System Programming Using C
Programming Using C
NextGen Forensics Week: Innovate Investigate Inspire
Utilizations of Solid Works with 3D Printing
Web App development using Flutter
Essentials of Digital Marketing in Retail Business
Teacher Impact Program for Personal and Professional Growth
Visual Data Analytics with PowerBI
Transformative Developments in the Indian Criminal Justice System.
Technological Advancement for Agricultural Sustainability and Food Secruity
Hands On Training on Data Science & Machine Learning
7-Day Hands on Training Program in Electronics, Scientific Writing & Digital Literacy
INTEGRATED BUILDING DESIGN & BIM TOOLS TRAINING
AI for Creativity
GenAI Innovation Sprint
Traditional Home Remedies for common Aliment
Think in java logic coding
Agentic AI: Principles and Practice
Electric Vehicles installation and design
Python programming with AI tools
Opportunities in clinical research and Pharmacovigilience studies
INDUSTRY COLLABORATED HANDS-ON TRAINING IN TABLET FORMULATION AND QUALITY EVALUATION
Java Programming for Beginners
Use of Modern Software in Mechanical Engineering
Title of SWS Java Programming for Beginners
Corporate ethics & etiquettes
Data Visualization for Career Advancement
Data Science and Analytics: From Data to Decision-Making
Practical Accounting & Global Software Bootcamp
Formulate to Nourish: Pharma-Crafted Nutraceutical Delights
“Intellectual Property Rights in Academia: Legal Foundations, Emerging Trends, and Innovation-Driven Applications”
Smart Finance: Empowering Lives Through Financial Literacy
Tools and Techniques of AI and Cyber Security.
Photoshop Fundamentals: From Beginner to Pro
Software Developer Essentials
IOT & Robotics
Structure Biology and Bioinformatics
Power BI
Learn Cyber Security With hands on session on preventing cyber attacks
Soil Testing for Sustainable Agriculture: A Hands-On Training for Students and Agri-Entrepreneurs
Learn French Language With Us
Data Science & Visualization with Python
Startup & its Anticipatory Management
Use of AI in Civil Engineering
Bhartiya History & Present Scenario
NextGen Coders: Developing Future-Ready Applications
Mobile Application Development
Media and Different Art Forms
UI/UX Design
Crypto currency: Future Money
Microorganisms from Varied Habitats: Identification and Functional Analysis
Iot, Robotics & Mechatronics : Smart Future
Digital Trials in India : Legal Technological and Practical perspectives
Professional Grooming and Business Etiquette
Sales Strategy & Consumer Behaviour
The Role of Alternative Dispute Resolution in Modern Legal Systems
AI Based Electrical Tools
Penetration Testing with Windows
Zero to Hero: C++, DSA & Jobs
Data Forensics
PARAMPARA – A Summer Kathak Retreat
Generative AI Tools for Web development & Data Analytics
Mastering Quantitative & Qualitative Aptitude for MBA Placements: Cracking the Code to Corporate Success
Generative-Ai
Full Stack development with MERN Stack
Visual Merchandising and Supply Chain Management
Foundations of Retail Management
Store and Retail Operations Management
Industrial Automation With IOT
Application of Embedded in real life
Significance Role of 3D modeling Softwares (NX) for an Industrial applications
Omnichannel Retail Operations Management
LORA Protocol (long range wide area network)
Web Development Using React Framework
Android App Development
Web Application Development
Data Analytics with Power BI
The Role of Innovative Techniques in Boosting Agricultural Productivity
Color Theory Lab
Python with DSA
ESCALATE YOUR OFFICE SOFT SKILLS
Unlocking Fisheries: The Science behind the Sustainable practices
From Campus to Corporate: Personality Enrichment Program
Web Application Development using flutter
Pharmacovigilance: Measures to ensure drug safety
Disaster Management and Business Continuity Planning
How to file Income Tax Return for Salaried Person
Industrial Internet of Things (IIoT)
Innovative Drug Delivery : Design, Profiling and Potential of Novel Therapeutics
Python for Data Preprocessing: Shaping Data for Analysis
Quant to Qualify: The Ultimate Aptitude Series
Azure Machine Learning Studio
IoT and it's Applications
Basic AI Tools for Managers
Enhancing Power of Programming through Logic Building
Digital marketing and Social Media
Digital Branding for Startups: Build, Promote and Grow
Describe your Concern
Course
AI-Driven Computing and Algorithm Design Using DSA
Code Mastery With Springboot
Analytical Techniques Used in Screening of Herbal Drugs
Data Analysis Using Advanced Excel
Omnichannel Retail and CRM
Automation Fundamentals
Creative Learning, Mindful Productivity and Personality Development
Mission UPSC & MPPSC Selection – Are You Ready?
CAD to Career: Industry Oriented Auto CAD
Data Analysis Master Class from Raw Data Real Insights
Managerial Skills and AI Tools
IOT & Embedded System: Fundamentals and Applications
Certificate Course in Cell Biology
Generative AI and Large Language Models (LLMs)
Frontiers in Life Sciences: Technologies and Solutions for UN SDGs
Siemens NX: Industry-Oriented CAD Design and Manufacturing Application
Data Analysis With Power BI
CPCT Complete Preparation Program
Industrial Internet of Things (IIoT): Smart Sensors, Connected Devices
Applied DSA & Competitve Problem Solving
Design Beyond Limits: AutoCAD for Civil & Mechanical Engineers
RAG Workshop: Build AI Apps That Know Your Data
Use of AI in Civil Engineering.
AI application development using python
AI- Powered Computing and Future Technologies
AI in Action: Project-Based Learning in Intelligent Computing
Problem Solving with Java and DSA
Future with Machine Learning
AI Powered Web Application Development
Generative AI and AI Application Development
Hands-On Practice on UV and HPLC
Forensic Science, Digital Evidence and Criminal Trial Advocacy
Research and challenges of Research Integrity
Modern Tools for Web development.
Mastering JAVA:Object Oriented Programming and Application Development
Emerging Trends inPharmaceutical Chemistry:AI,Analytics&Sustainability
Horizon : Exploring Social Sciences Beyond Boundaries of Books
Build your Own Chatboat using Gen AI.
Creative Thinking Processes and Methods
Artificial Intelligence and Emerging Technologies
Broadcast Journalism, News Anchoring and Live Production
Internet of Things (IoT) and Smart Device Development
Climate Smart Agriculture
“Emerging Trends and Innovations in Agribusiness Management.”
Google Cloud Platform Foundation
Applied AI: Real World Application Development using AI
IOS App Design and Development
GenAI with OpenAI and Python
Impact of AI Adoption on Financial Performance and Managerial Effect
Clinical Edge blueprints on Clinical Trails and Pharmacovigilance
C++ and Object-Oriented Programming: Fundamental to Real World Project
From Design to Part: Hands-on CNC Machining and 3D Printing
AI For Every One Smart Work With Artificial Intelligence
Hands on Training on Advance Analytical Techniques
Digital Marketing Basics
Competitive Programming and Algorithmic Thinking
Generative AI_ Leadership Towards Tomorrow
20-Hour Industry-Oriented Training Program on Web Product Development
Tally Prime: From Basics to Advanced Accounting
Digital Commerce Economics and Revenue Optimization
Introduction to AWS Cloud-Based Machine Learning & Intelligent System
Legal Drafting, Pleading And Advocacy: From Theory to Practice
Certificate Course in Tally Prime and Business Accounting
Job Readiness and Career Skills
Robotics, Automation & IoT with Arduino and ESP32
Professional Diploma in Java Full-Stack Development
Professional Diploma in Python Programming and Application Development
Advanced Certification in Python for Data Analysis & Automation
Professional Diploma in Data Analytics and Business Intelligence
Professional Diploma in AI-Enabled Full-Stack Web Development
Advanced Certification in Data Analytics and Visualization
Advanced Certification in AI-Powered Web Development
Advanced Certification in Java Programming
Technical Fundamentals for Placements
Certificate Course in Dermatoglyphics
Placement Readiness & Employability Skills
Certificate in Python Programming
Certificate in C Programming
HR Analytics Essentials
Certificate in Data Analytics
Certificate in Java Programming
Certificate in AI-Enabled Web Technology
Integrated MPPSC Preparation Course
Certificate Course in Cell Biology
Experimental techniques in Biological Sciences
Certificate Course in Counselling Tools&Techniques
Certificate Course in Diagnostic Electrophoresis
Certificate Course in Mutation Research
Certificate Course in Clinical Microbiology
Basics of Python Programming for Pharmacy Students
Tribal Masks: A Reflection of India's Traditional Knowledge Systems
Transform technologies of Artificial Intelligence, Augmented Reality, Virtual Reality, and Mixed Reality
How Artificial Intelligence is Transforming Journalism and Performing Arts: Creativity vs Authenticity
Advanced Training in Laboratory Animal Handling and Preclinical Pharmacological Screening
Personality Development for Professionals
AgriXperience 1.0: Hands-On Training Agri- Lab Skills & Smart Tech
Fundamentals of Generative AI & Large Language Models(LLMs)
Cyber Law And Digital Security In India
Artificial Intelligence and Enhancing Communication Skills
AI for Budding Managers : Tools & Applications - module 2
Smart Infrastructure & Urban Planning Using AI
AI-Enabled Full Stack Development
AI-Based Virtual Assistants: Siri and Alexa
Structural and Material Engineering Using AI
Integrating Artificial Intelligence in Experimental Pharmacology: Bridging in Silico Prediction with in Vivo Validation
Python Basics to Brilliance: A Journey from Beginner to Confident Coder
Generative AI Lab: Create Smarter Systems and Smarter Ideas
AI Tools for Future Ready Management Smart Decision Making & Digital Leadership
AI-powered facial recognition
Emerging Trends in Cyber Security and Data Privacy
Mastering Power BI for Data Analytics
IOT Revolution Connecting the Future
Image Building & personality Devlopment
Industrial Automation & IIoT 4.0
Entrepreneurial Mindset and startup skills
Design in Pixels: Photoshop
API to Finished Product in Pharmaceutical Dosage Form
Java Foundations for Future Software Developers
Agentic AI: From Prompting to Autonomous Intelligence
Advanced Training Program on Drug Development and Analysis
Business Intelligence with Power BI
Robotics & AI
Recent Innovations in Electric Vehicle Design, Advanced Materials, and Manufacturing Technologies
Introduction to IoT: Concepts and Applications
AI in supply chain management
Python Ignite Program: Beginner to Project Builder
Digital Marketing
Learn Blockchain the Bitcoin Way
Power BI – Data to Dashboard
Machine Learning Applications with Agentic AI
CAD Verse: From Idea to Production
Recent Advancements in Cyber Forensics and Insurance Investigations
Next-Gen Embedded System Design
Master in Laravel with industry Expert
Generative AI Revolution: Transforming Ideas into Reality
Experimental Techniques in Biochemistry, Microbiology and Molecular Biology: A Practical Approach
Building Information Modeling (BIM) & Future Construction Technologies
Code Smart with Spring Boot
Internet of Things (IOT) based embedded system design
AI's Ascent: From Consumers to Creators
Bootcamp for Data Analysis: Python, NumPy, and Pandas
Introduction to Indian Knowledge System
Corporate Skill Required to Succeed After BBA
Change, Transformation and People: Navigating the Human Side of Organizational Evolution
Agentic AI
Data Analyst Master Class by Using Power BI, SQL, and MS Excel
Cell Biology
Instrumentation in Clinical Research
Integrating Digital Health and Telemedicine into Nursing Practice
Good Clinical Practice (GCP) & Good Laboratory Practice (GLP)
Fundamentals of Generative AI & prompt engineering
Indian Knowledge System in Banking & Finance: Tradition to Transformation
Skill Up With Income Tax Act 2025
Vocal Music Workshop With Creative Digital Notation
Entrepreneurial Mindset & Innovation Management
Full Stack Web Development with Python(Django, Flask & Fast API)
Pathways to Civil Services Examinations
Diagnostic Electrophoresis
Alternative Dispute Resolution: Law, Practice, and Emerging Trends in India.
Hands-on IoT Development using ESP8266 and Sensors
Clinical Microbiology
Competitive Programming
FutureAg: Advancing Agriculture for Tomorrow
Tide Turners: Innovations in Aquatic Science
Mutual Funds and Wealth Creation: Practical Perspectives
Hands on Training on Chromatographic and Spectroscopic Technique
Interactive Web Development with HTML, CSS & JavaScript
AI for Budding Managers : Tools and Application
Data Analysis Using Advanced Excel And AI
Communication Skills Talk to Masses
Leadership Skills by Shri N. Raghuraman
Project Design and Development
Artificial Intelligence (AI) Fundamentals & Prompt Engineering
Certificate Course in Dermatoglyphics
Certificate course in Counselling tools and Techniques
visa assistance intelligence visa guidance with AI agent
Green Biotech Skill Enhancement Course
Certificate Course in Mutation Research.
Certificate Course in Cell Biology
Applied Python: Build Applications & Solve Problems
transforming nursing through artificial intelligence, education -practice &innovation.
DATA ANALYSIS MASTERCLASS: FROM RAW DATA TO REAL INSIGHTS
HACKDEFEND: 15 DAYS TO CYBER ADVANCEMENT
Next Generation Biofertilizers & Biopesticide :Genomics-Driven Innovations for Sustainable Agriculture
Basics of Robotics & Artificial Intelligence
Women,Chidren & The New Criminal Laws:Understanding Protection, Rights and Reforms
Business Model Innovation and Startup Plan Development
Generative AI Lab: Create Smarter Systems and Smarter Ideas
AI tools for modern Business
Dance & Music
CERTIFICATION COURSE IN BANKING, FINANCE & INSURANCE
Marketing Accelator Series
Python with Power BI
CBT and Mindfulness-Based Emotional Wellbeing Program
The Art of Photography for Young Creators
Summer Sketch Fusion
Foundations of AI & Machine Learning
Mastering Core Java: Concepts to Code
AI/ML Using Python
AI, AR, VR Mixed Reality
AI in Real-World Applications & Data Science Techniques
From Zero to Hero - Mastering Ai with IOT
Impact of GST on Startup Growth and Compliance in India
Personality Development for Professionals
Data Analysis using advance Excel
Introduction to Advance concept of Block Chain Technology
Robotics AI Robotic arms and manipulators • End-effectors and grippers • Safety systems in industrial robots • Flexible automation and robotic cells • Industry 4.0 and smart manufacturing
MS Office for Everyone: Core Foundations & Practical Applications
Generative AI for business with Azure AI
AI-Driven Digital Marketing: Planning, Execution, and Optimization
Value Addition & Food Safet skill Development for New Age Entrepreneurs
Emotional Intelligence
Futuristic Project Based Learning using AI/ML
System Programming Using C
Programming Using C
NextGen Forensics Week: Innovate Investigate Inspire
Utilizations of Solid Works with 3D Printing
Web App development using Flutter
Essentials of Digital Marketing in Retail Business
Teacher Impact Program for Personal and Professional Growth
Visual Data Analytics with PowerBI
Transformative Developments in the Indian Criminal Justice System.
Technological Advancement for Agricultural Sustainability and Food Secruity
Hands On Training on Data Science & Machine Learning
7-Day Hands on Training Program in Electronics, Scientific Writing & Digital Literacy
INTEGRATED BUILDING DESIGN & BIM TOOLS TRAINING
AI for Creativity
GenAI Innovation Sprint
Traditional Home Remedies for common Aliment
Think in java logic coding
Agentic AI: Principles and Practice
Electric Vehicles installation and design
Python programming with AI tools
Opportunities in clinical research and Pharmacovigilience studies
INDUSTRY COLLABORATED HANDS-ON TRAINING IN TABLET FORMULATION AND QUALITY EVALUATION
Java Programming for Beginners
Use of Modern Software in Mechanical Engineering
Title of SWS Java Programming for Beginners
Corporate ethics & etiquettes
Data Visualization for Career Advancement
Data Science and Analytics: From Data to Decision-Making
Practical Accounting & Global Software Bootcamp
Formulate to Nourish: Pharma-Crafted Nutraceutical Delights
“Intellectual Property Rights in Academia: Legal Foundations, Emerging Trends, and Innovation-Driven Applications”
Smart Finance: Empowering Lives Through Financial Literacy
Tools and Techniques of AI and Cyber Security.
Photoshop Fundamentals: From Beginner to Pro
Software Developer Essentials
IOT & Robotics
Structure Biology and Bioinformatics
Power BI
Learn Cyber Security With hands on session on preventing cyber attacks
Soil Testing for Sustainable Agriculture: A Hands-On Training for Students and Agri-Entrepreneurs
Learn French Language With Us
Data Science & Visualization with Python
Startup & its Anticipatory Management
Use of AI in Civil Engineering
Bhartiya History & Present Scenario
NextGen Coders: Developing Future-Ready Applications
Mobile Application Development
Media and Different Art Forms
UI/UX Design
Crypto currency: Future Money
Microorganisms from Varied Habitats: Identification and Functional Analysis
Iot, Robotics & Mechatronics : Smart Future
Digital Trials in India : Legal Technological and Practical perspectives
Professional Grooming and Business Etiquette
Sales Strategy & Consumer Behaviour
The Role of Alternative Dispute Resolution in Modern Legal Systems
AI Based Electrical Tools
Penetration Testing with Windows
Zero to Hero: C++, DSA & Jobs
Data Forensics
PARAMPARA – A Summer Kathak Retreat
Generative AI Tools for Web development & Data Analytics
Mastering Quantitative & Qualitative Aptitude for MBA Placements: Cracking the Code to Corporate Success
Generative-Ai
Full Stack development with MERN Stack
Visual Merchandising and Supply Chain Management
Foundations of Retail Management
Store and Retail Operations Management
Industrial Automation With IOT
Application of Embedded in real life
Significance Role of 3D modeling Softwares (NX) for an Industrial applications
Omnichannel Retail Operations Management
LORA Protocol (long range wide area network)
Web Development Using React Framework
Android App Development
Web Application Development
Data Analytics with Power BI
The Role of Innovative Techniques in Boosting Agricultural Productivity
Color Theory Lab
Python with DSA
ESCALATE YOUR OFFICE SOFT SKILLS
Unlocking Fisheries: The Science behind the Sustainable practices
From Campus to Corporate: Personality Enrichment Program
Web Application Development using flutter
Pharmacovigilance: Measures to ensure drug safety
Disaster Management and Business Continuity Planning
How to file Income Tax Return for Salaried Person
Industrial Internet of Things (IIoT)
Innovative Drug Delivery : Design, Profiling and Potential of Novel Therapeutics
Python for Data Preprocessing: Shaping Data for Analysis
Quant to Qualify: The Ultimate Aptitude Series
Azure Machine Learning Studio
IoT and it's Applications
Basic AI Tools for Managers
Enhancing Power of Programming through Logic Building
Digital marketing and Social Media
Digital Branding for Startups: Build, Promote and Grow
Describe your concern
Please Enter the Captcha Text
Request a Call